
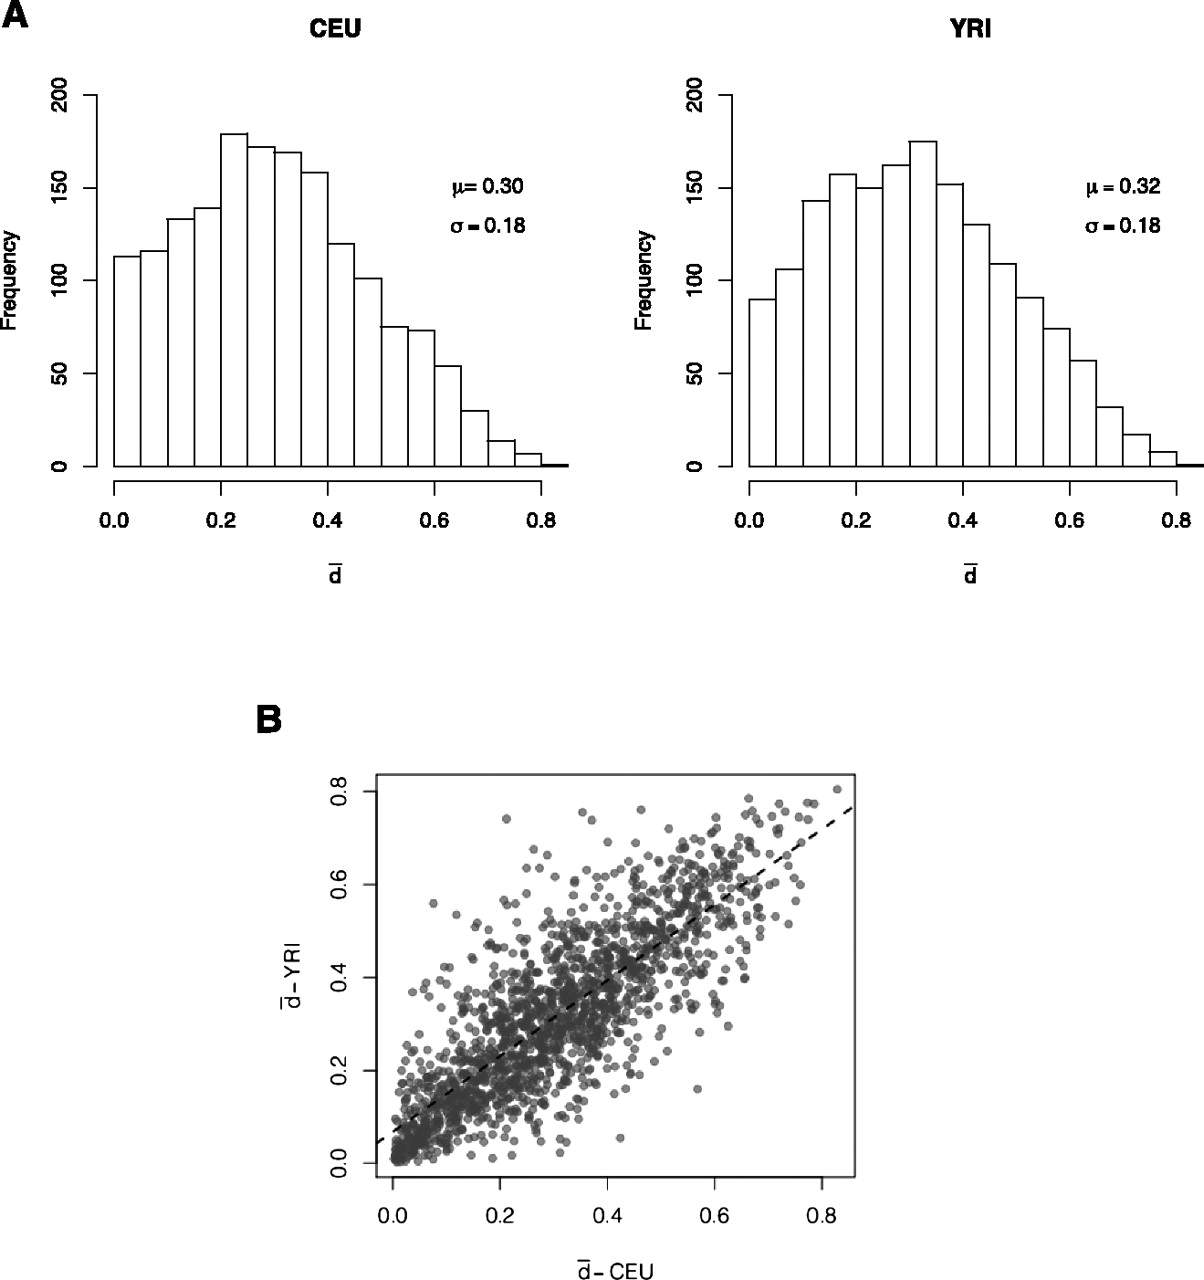
Figure 3.
(A) Variability in alternative splicing within human populations. Distribution of the splicing variability within Caucasian
(CEU) and Nigerian (YRI) populations. Splicing variability, represented here by  , has been measured as the mean Hellinger distance to the centroid of the relative abundances of alternative splice forms
(see Methods). (B) Variability in alternative splicing between populations. Pearson correlation coefficient: 0.81; P-value < 2.2 × 10⁻¹⁶.
, has been measured as the mean Hellinger distance to the centroid of the relative abundances of alternative splice forms
(see Methods). (B) Variability in alternative splicing between populations. Pearson correlation coefficient: 0.81; P-value < 2.2 × 10⁻¹⁶.


