
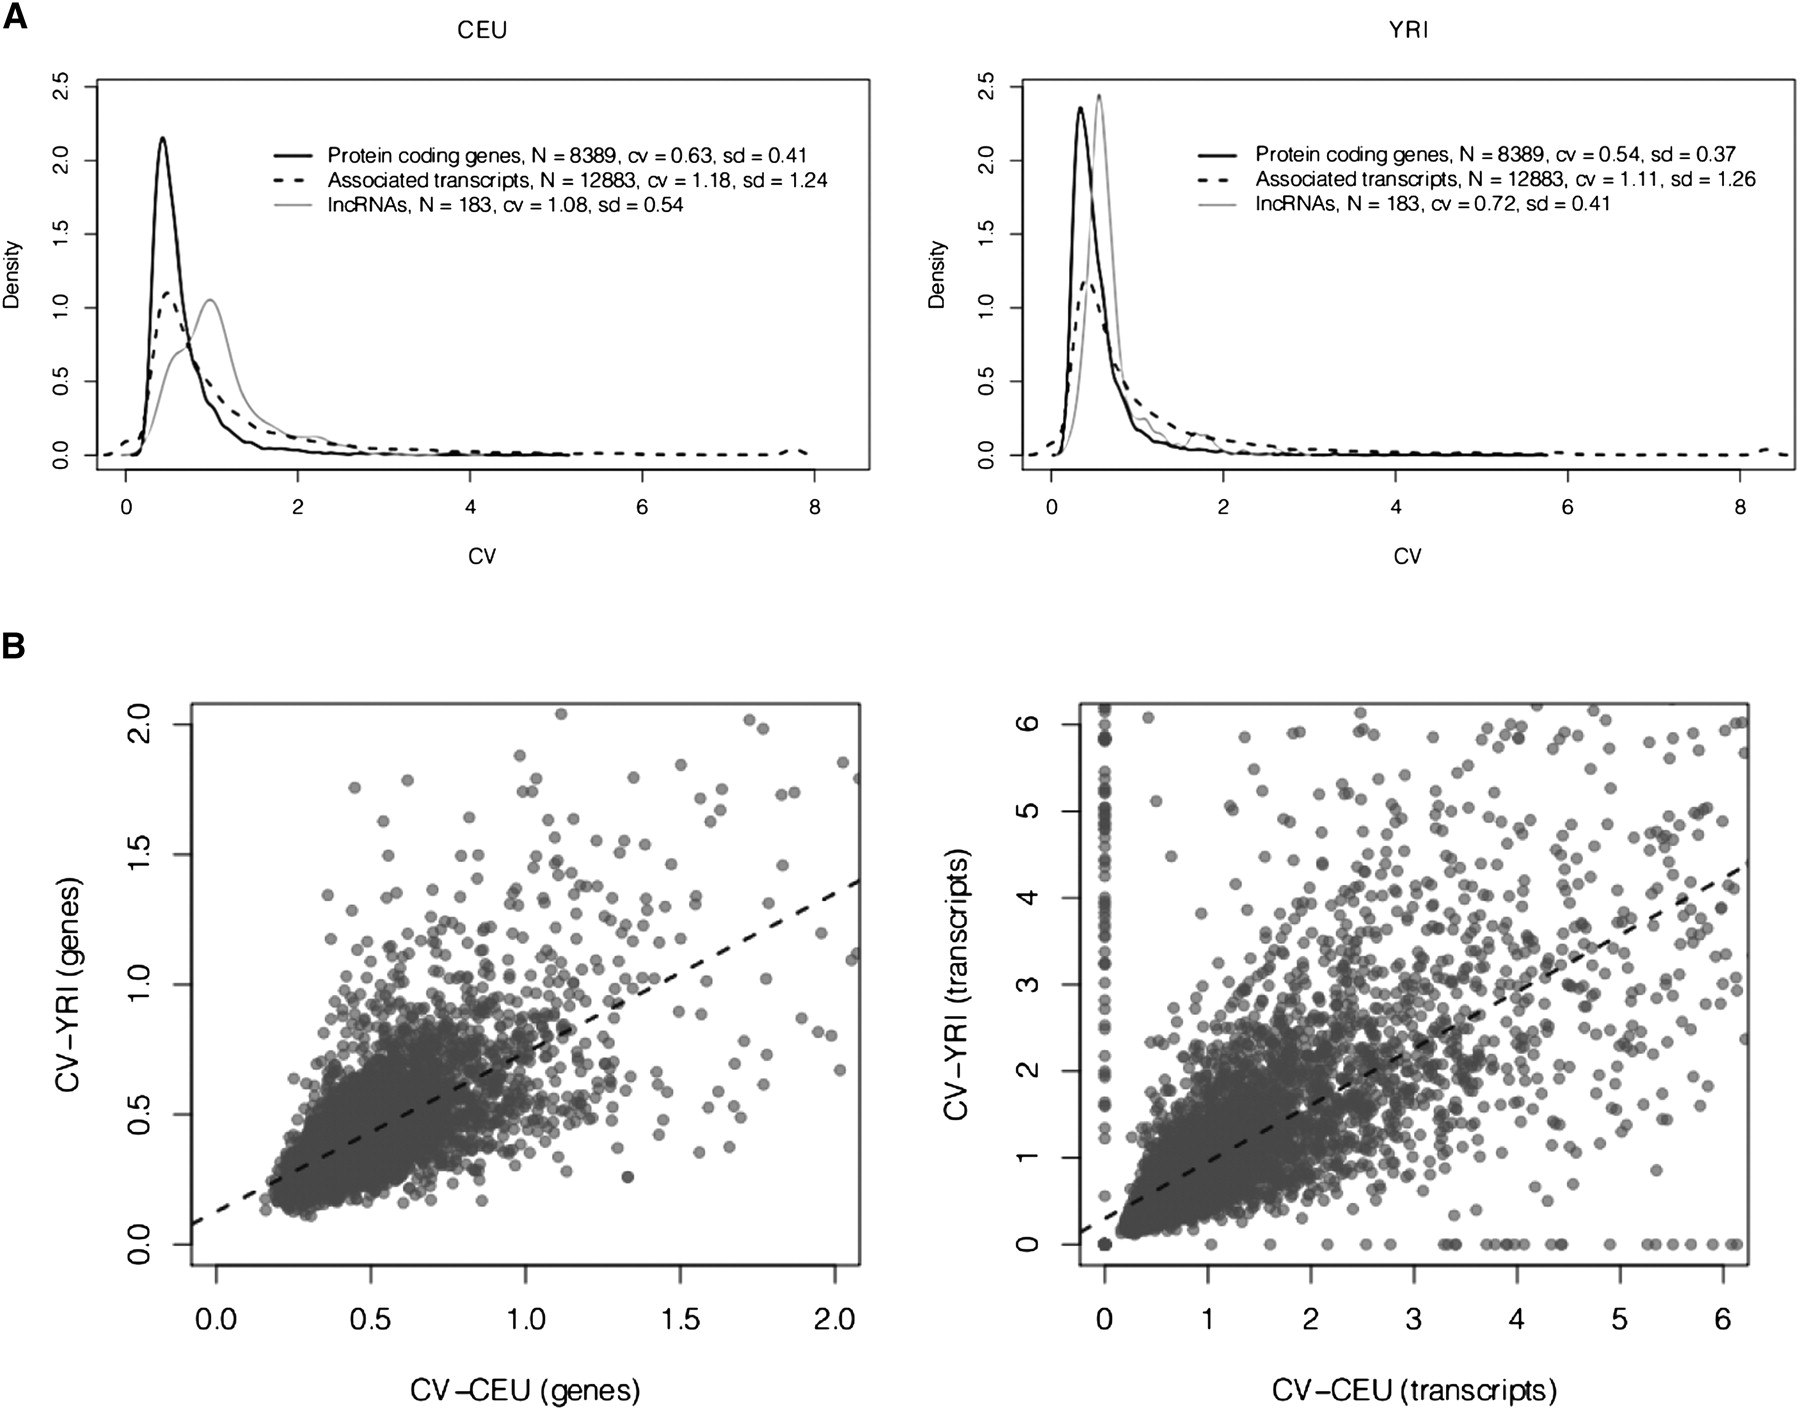
Figure 2.
(A) Variability in gene expression within human populations. Distribution of the coefficient of variation of gene expression within Caucasian (CEU) and Nigerian (YRI) populations. Only genes that passed the first set of filters were considered here (see Table 2). (B) Variability in gene expression between populations. Pearson correlation coefficients: 0.66 and 0.65 for genes and transcripts, respectively; P-value < 2.2 × 10⁻¹⁶ in all cases. Only genes that passed the first set of filters were considered here (see Table 2), and values up to cv = 2 and cv = 6 have been represented in each case.


