
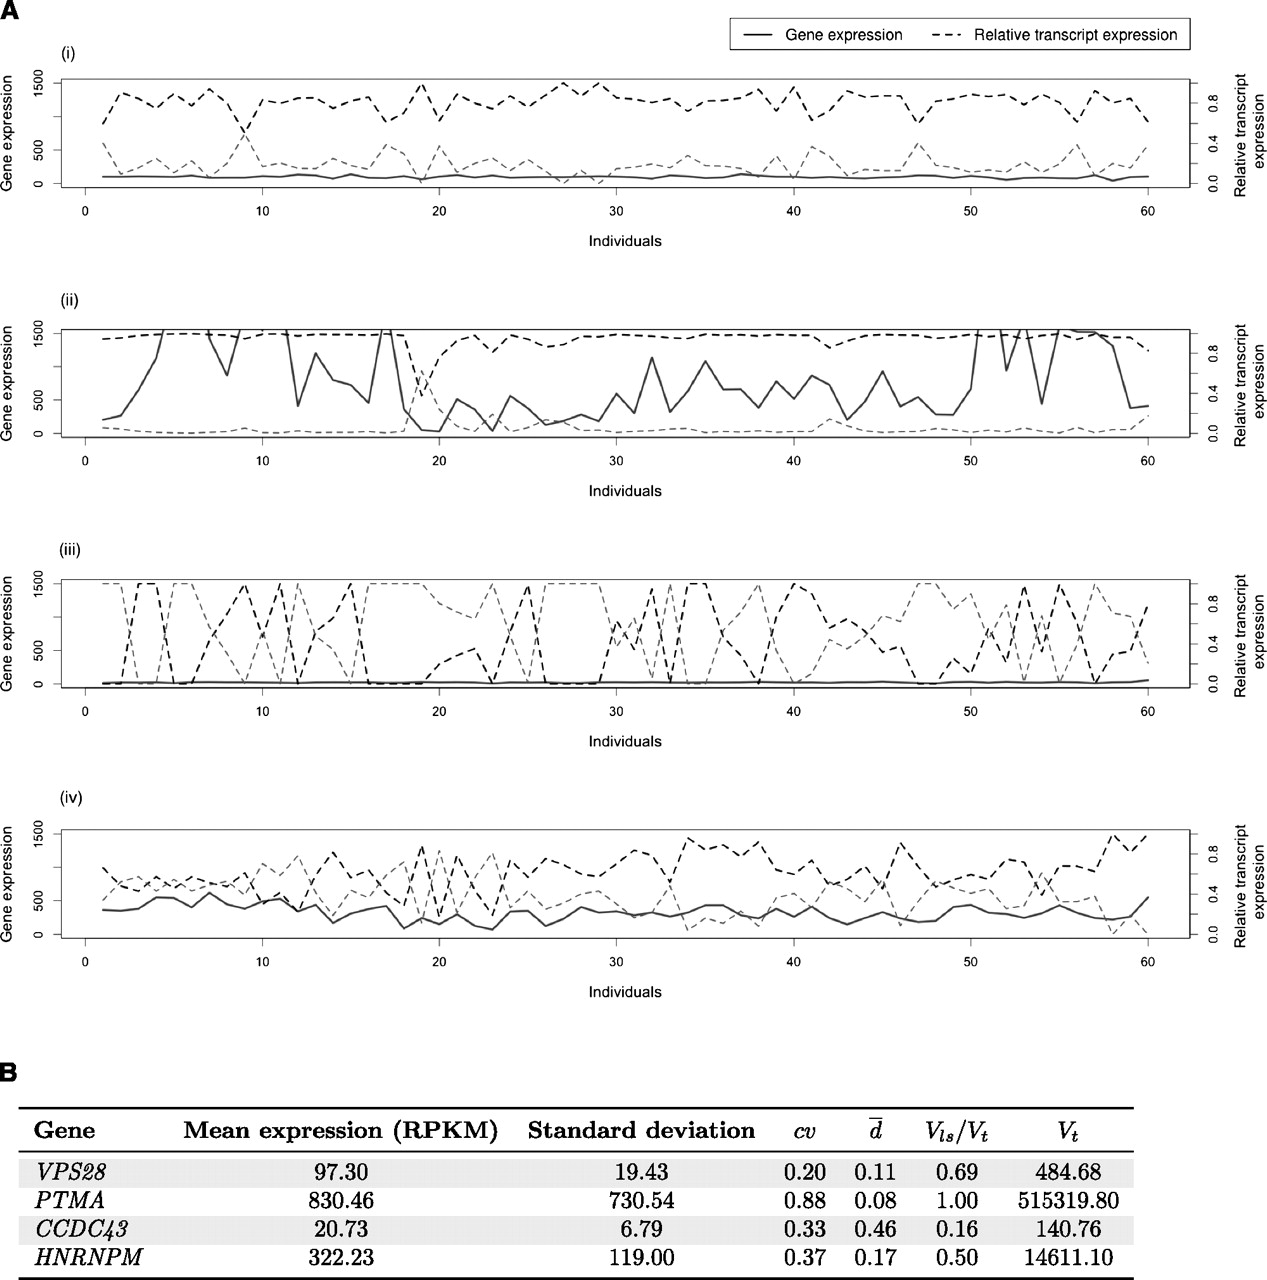
Variability in gene expression versus variability in splicing ratios. (A) Behavior of four different genes regarding expression and splicing variability in human populations. Four genes with two
splice forms each have been selected to illustrate possible extreme cases: (i) Low variability in both gene expression and
splicing (as exhibited by the Vacuolar protein sorting-associated protein 28 homolog gene, VPS28); (ii) variability in gene expression, but quite constant splicing ratios (as exhibited by Prothymosin alpha, PTMA); (iii) constant gene expression, but variability in alternative splicing ratios (as exhibited by the Coiled-coil domain
containing 43 gene, CCDC43); and (iv) variability in both gene expression and alternative splicing ratios (as exhibited by the Heterogeneous nuclear
ribonucleoprotein M, HNRNPM). The x-axis denotes the 60 individuals in which the values have been profiled (data from Montgomery et al. 2010) and the y-axis both absolute gene expression (measured in RPKMs; see text) and relative splicing ratios. (B) Attempts to quantify variability in transcript expression and alternative splicing ratios. (cv) Coefficient of variation of gene expression. ( ) Our proposal to measure variation in splicing ratios. (Vt) Sum of the variances of the abundances of the different splice forms. (Vls/Vt) In our approach, the fraction of the total variability that can be explained by variation in gene expression. The parameters
that we introduce in this report—
) Our proposal to measure variation in splicing ratios. (Vt) Sum of the variances of the abundances of the different splice forms. (Vls/Vt) In our approach, the fraction of the total variability that can be explained by variation in gene expression. The parameters
that we introduce in this report— , Vls/Vt—seem to capture well our intuitive interpretation of the variability in splicing ratios and the relative contribution of
gene expression to total transcript variability (see text).
, Vls/Vt—seem to capture well our intuitive interpretation of the variability in splicing ratios and the relative contribution of
gene expression to total transcript variability (see text).


