
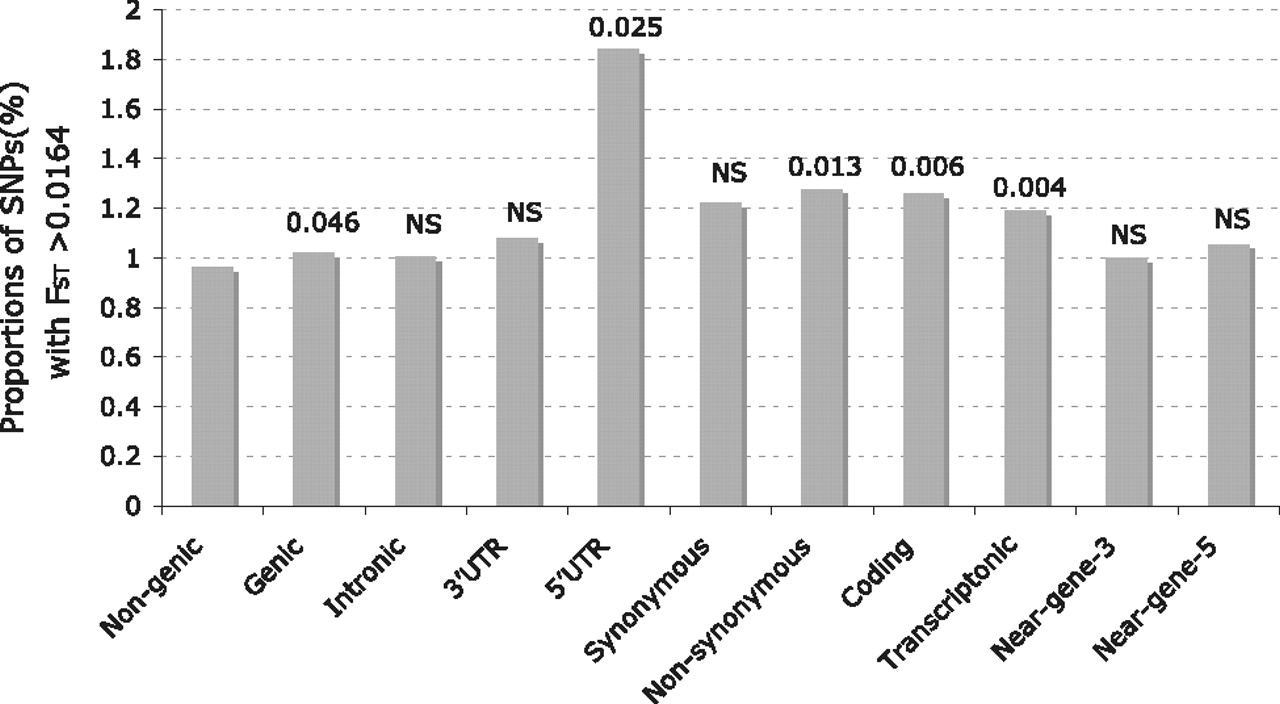
Figure 3.
Enrichment of high FST loci for different SNP categories. Observed excess of high FST loci in different SNP classes, with respect to nongenic class, in the high FST bin (99th percentile; FST > 0.0164). The values on the bar are P-values of χ2 tests. NS, not significant.


