
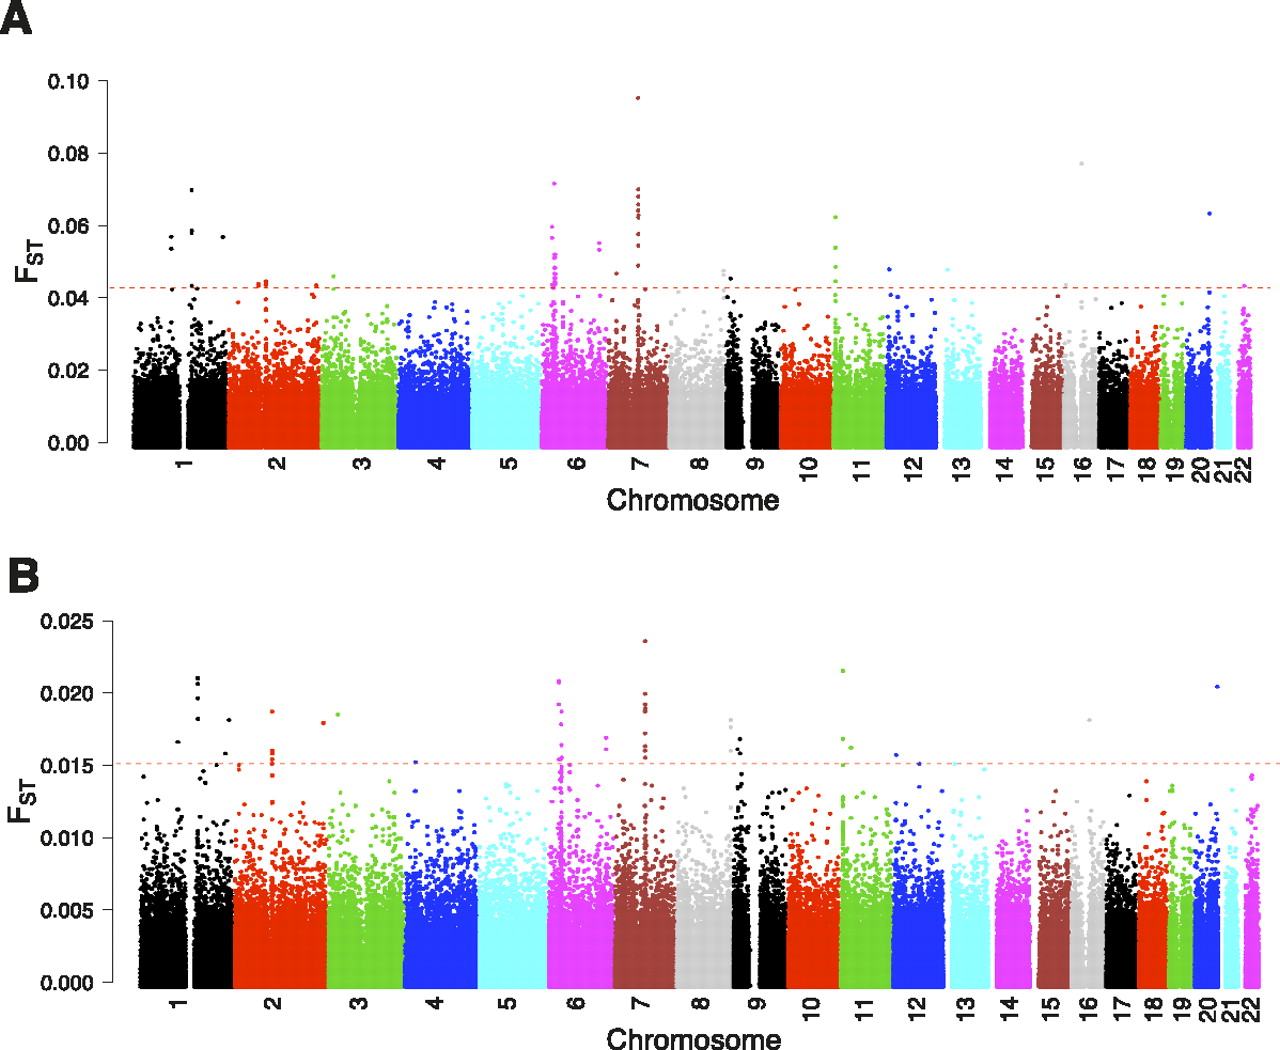
Figure 2.
(A) Genomic distribution of FST between AAF and YRI. (B) Genomic distribution of FST between AfA and rAfA. Dashed red horizontal line indicates the cutoff threshold (99.99th percentile). Locus-specific FST between YRI and CEU were calculated when MAF > 0.05 in both populations. The rAfA was constituted according to the ancestry proportion of CEU and YRI under neutrality.


