
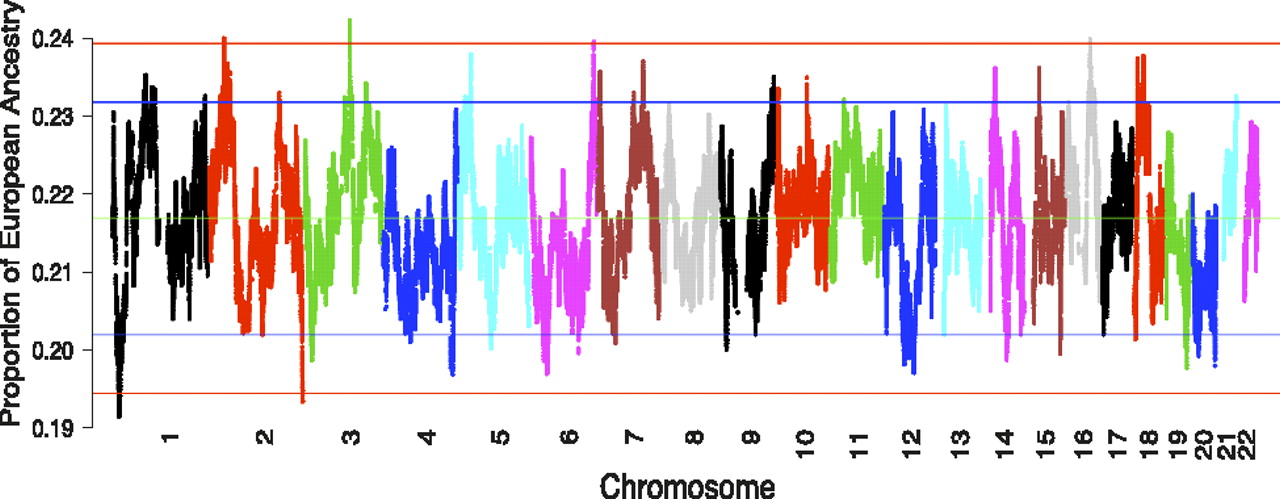
Figure 1.
Genome-wide distribution of European ancestral contributions. Mean European ancestral contribution across 1890 African-American individuals at each SNP. (Green line) Estimated genome-wide mean European ancestral contribution (21.68%). Blue bands indicate +2 and −2 SDs from the mean ancestral contribution and red bands indicate +3 and −3 SDs from the mean ancestral contribution.


