
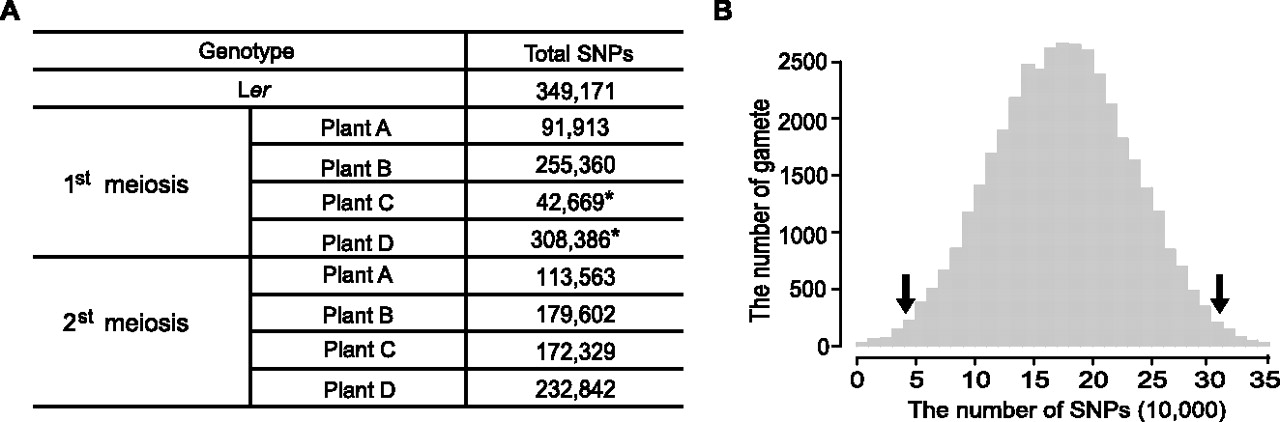
Figure 7.
The distribution of SNPs in meiotic products. (A) The number of SNPs in Ler and eight experimented meiotic products. As the Col sequence was used as reference, the pure Col region had zero SNPs and only bases different from Col were counted. Two extreme gametes are marked by black asterisks, with one highly similar to Col and the other very similar to Ler. (B) The distribution of SNPs in 40,000 simulated gametes. Simulation was performed according to genetic and physical maps of Arabidopsis. The unit of the x-axis is 10,000. Two black arrows indicate the location of two extreme gametes in the simulated distribution.


