
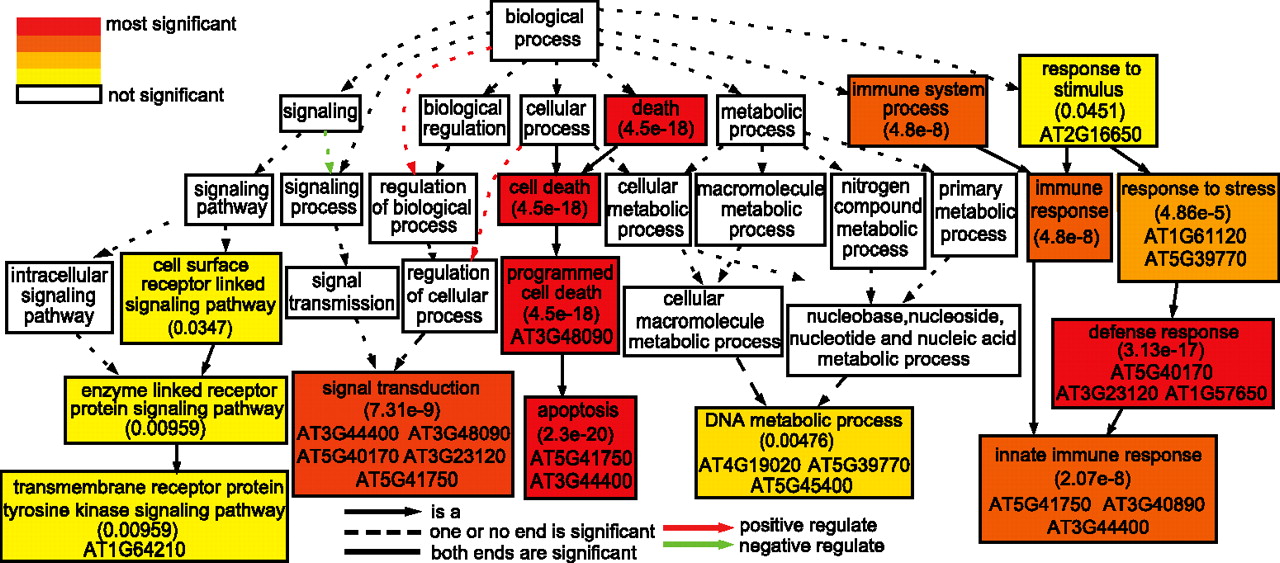
Figure 3.
Gene Ontology groups enriched among genes with 10 or more nonsynonymous SNPs. Statistical significance is color coded, with Yekutieli FDR adjusted P-value shown in each significant group. Most enriched GO groups contain some genes with large dN/dS values (≥1.6), as shown by TAIR gene IDs in the box.


