
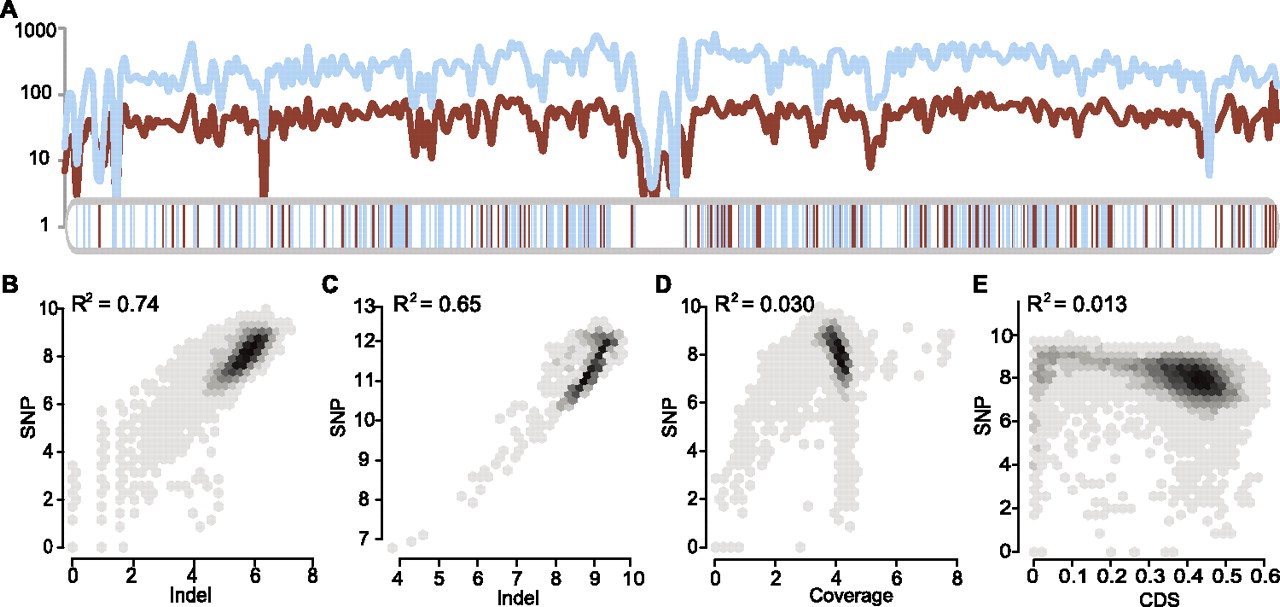
Figure 1.
The correlation of SNP and small indel densities. (A) Parallel change of SNP and small indel density on Chr1. The density was defined to be the number of SNPs/indels per 100 Kb. (Blue curve) SNP density; (red curve) small indels. Blue and red vertical bars below show the location of large deletions and insertions, respectively. (B,C) Linear regression of SNP and indel densities in 100-Kb (B) or 1-Mb (C) sliding windows. (D,E) Linear regression of SNP density with read coverage (D) or CDS fractions (E) in a 100-Kb sliding window. All values are log2 transformed before applying regression. A near zero R2 value suggests that read coverage or CDS fractions do not contribute much to the correlation.


