
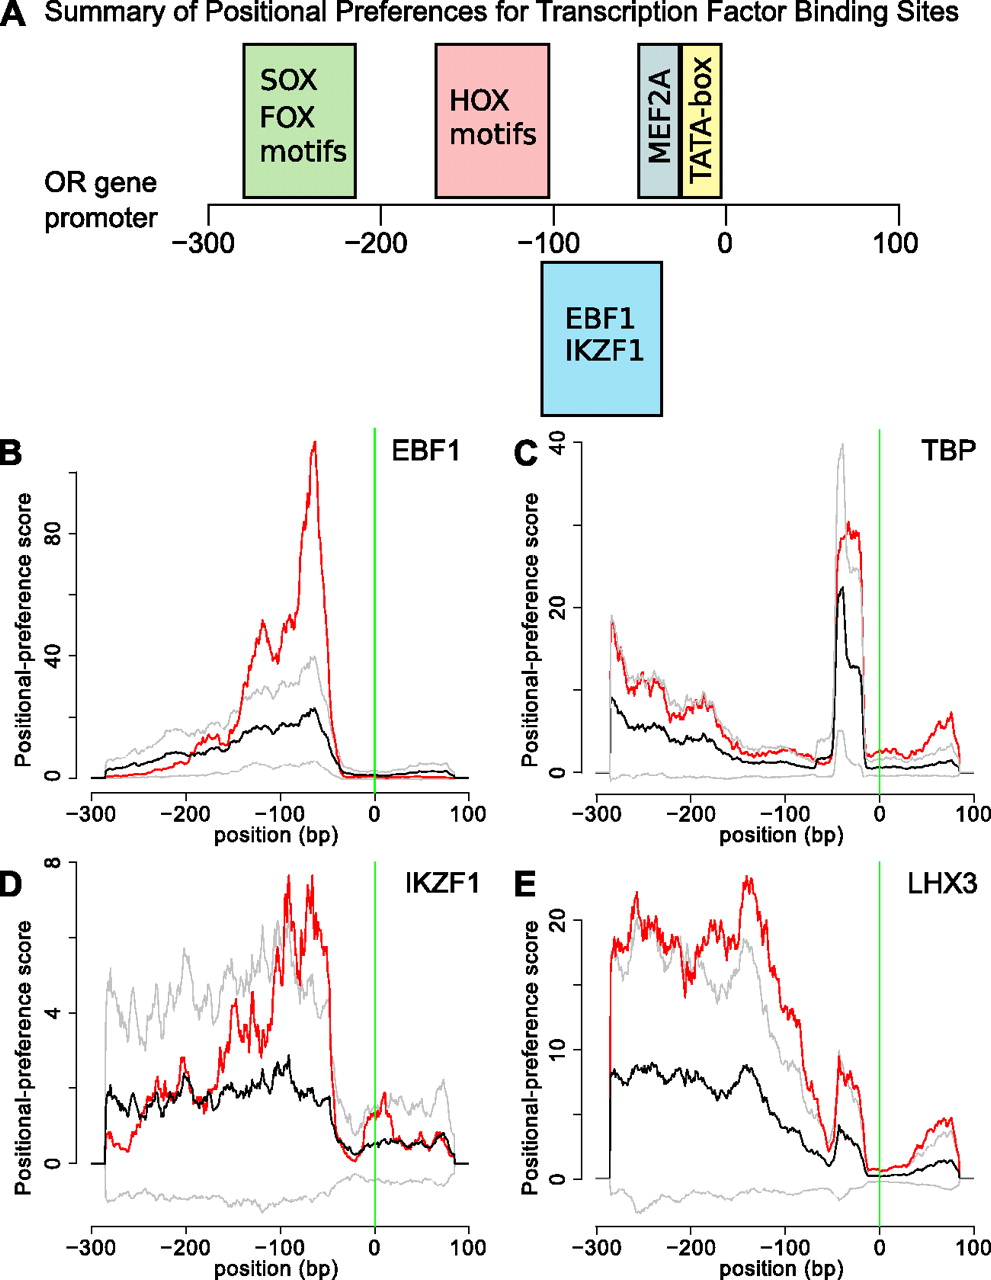
Figure 3.
Transcription factor binding profile over OR promoters. (A) Summary of positional preferences for TFBS in relation to the major TSS. (B–E) TF binding site motif profiles in OR (red) versus reference set of promoters (black). (Gray lines) 99.99% confidence intervals around the mean TFBS positional preference profile for the background set used. (Vertical green lines) The position of the major TSS.


