
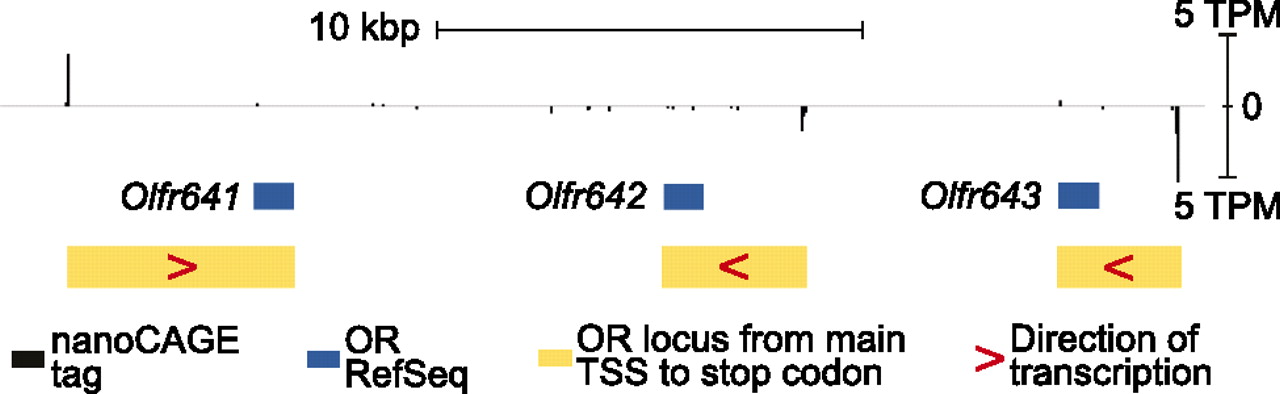
Promoters of olfactory receptor genes. In this example of a region of chromosome 7, which is symbolized as the horizontal axis, the transcription start sites have been plotted as vertical bars proportional to the number of nanoCAGE tags aligned, normalized in tags per million (TPM). Activity is displayed upward for the forward strand and downward for the reverse strand. (Blue boxes) The positions of the OR transcript models, with their names following the Olfr convention. Note that the transcript models contain only the predicted coding sequence of the ORs and lack the 5′ and 3′ UTRs. Sequence conservation and expression filtering identified the three largest peaks as promoters of their downstream OR gene model. (Yellow) The revised gene models.


