
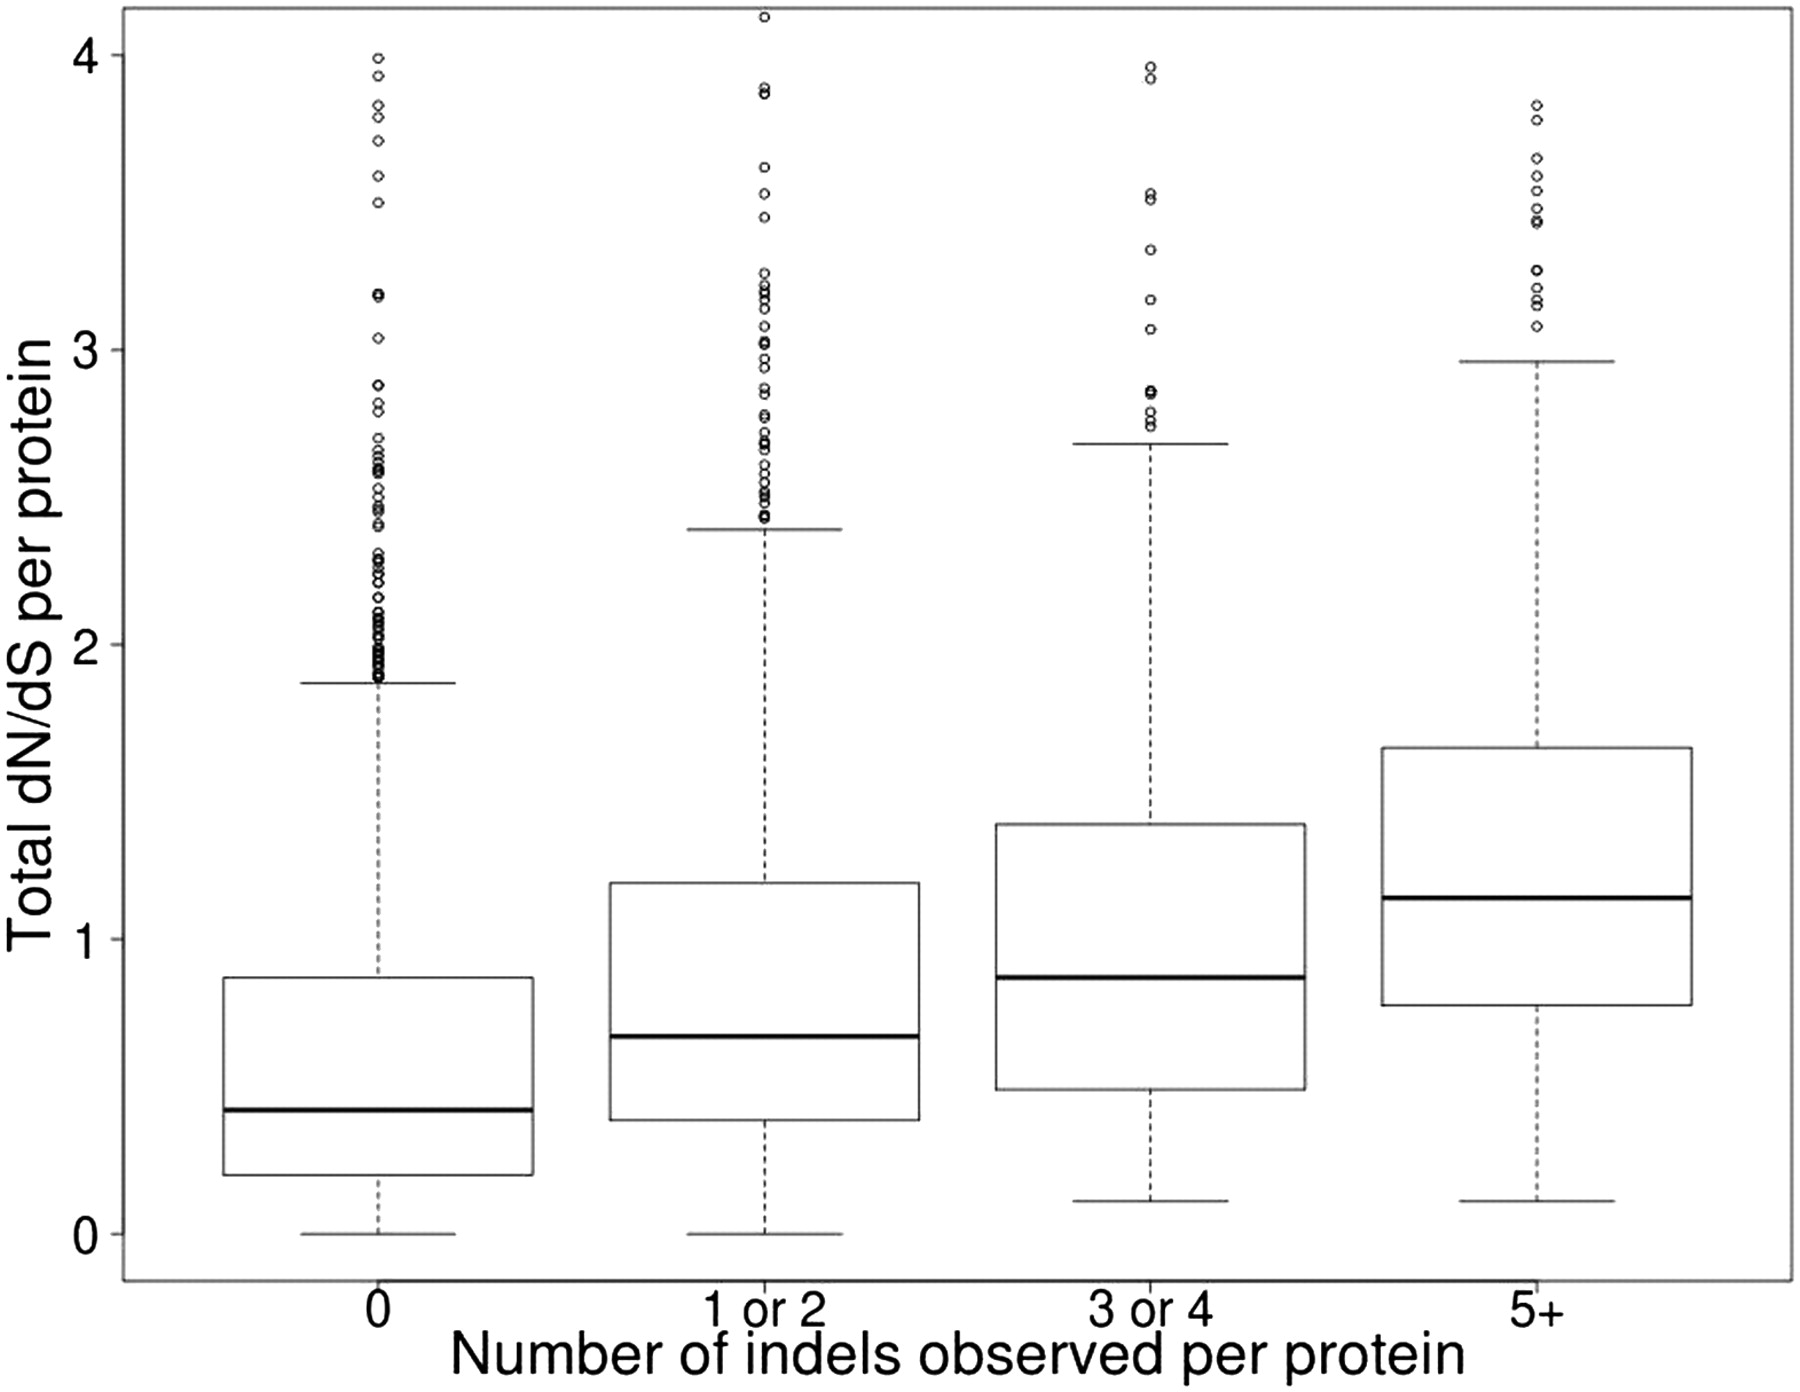
Figure 4.
Positive relationship between nonsynonymous-to-synonymous substitution (dN/dS) ratio and number of indels in coding sequences. Box-plot representation of dN/dS versus number of indel events. The y-axis is the sum of the dN/dS for all branches for a particular protein. The x-axis is the total number of indels observed in all branches for a particular protein. The area within the box contains 50% of the data; the horizontal line is the median; outliers (5%) are represented as small circles. Each category is significantly different from each of the others (P ≪ 0.0001, Wilcoxon rank sum test). Spearman's rank correlation rho = 0.34 (P ≪ 0.0001).


