
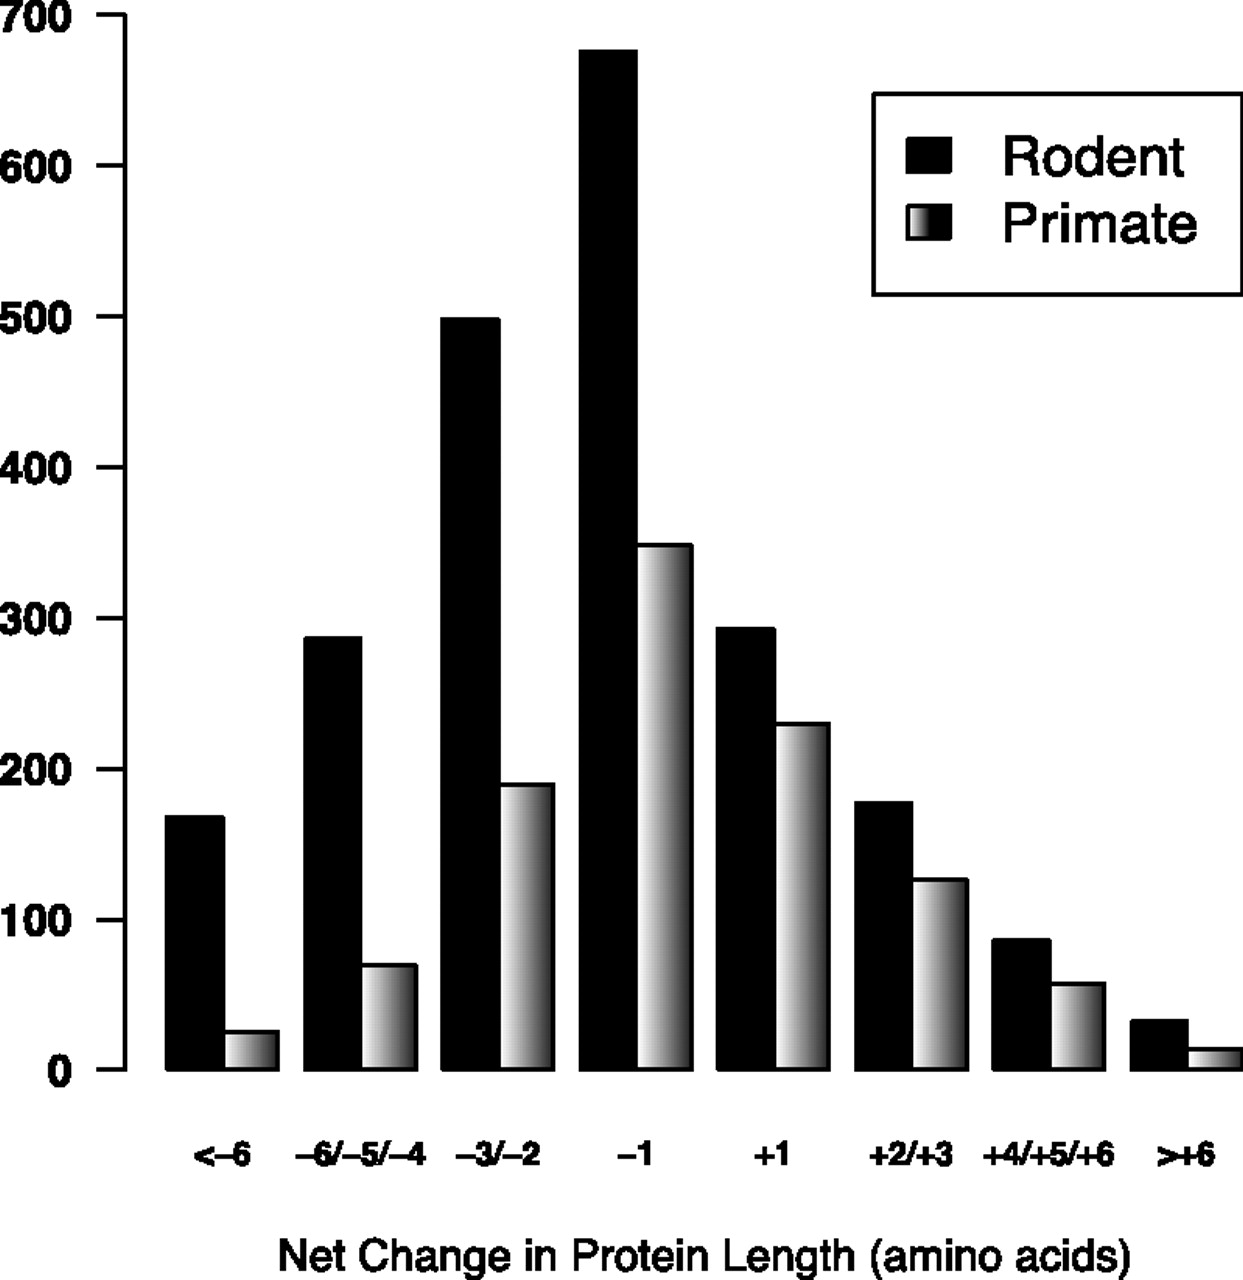
Figure 3.
Increased protein sequence loss in the rodent branch. Negative values indicate net sequence loss; positive values, net sequence gain. Cases in which there were no insertions or deletions, or in which they balanced out, are not included. The other branches produced a similar graph to that of the primate branch.


