
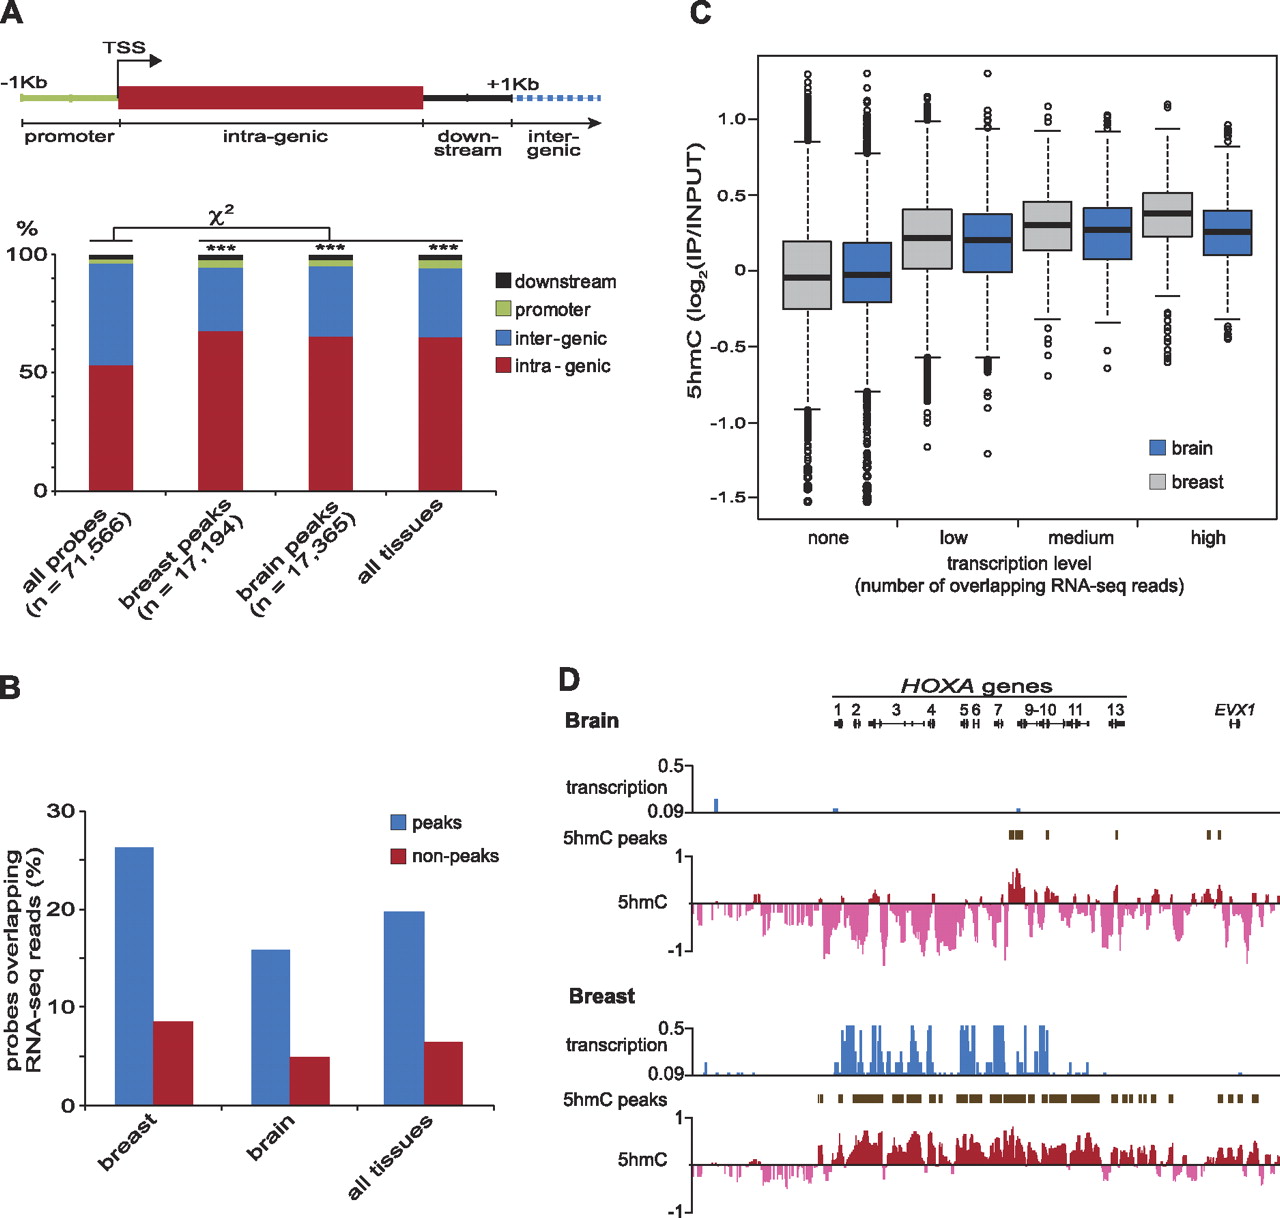
5hmC is enriched in transcribed regions. (A) Diagram illustrating the defined genomic regions that are assayed for %5hmC enrichment. All probes found within peaks of 5hmC enrichment were classified according to their genic location. The bar chart below illustrates that probes within peaks of 5hmC (“peak-probes”) are enriched in intragenic regions in brain and breast tissues. See text for definition of 5hmC peaks. (B) Bar chart illustrating that the peak-probes associate with regions of active transcription in brain and breast. The percentage of probes overlapping RNA-sequencing reads for each tissue is shown. (C) Box plot showing that 5hmC levels increase with steady-state transcript levels. Each probe was classified according to its number of overlapping RNA-sequencing reads for brain and breast; none = 0, low = 1, medium = 1–5, high > 5. (D) The presence of 5hmC is associated with transcription. The HOXA cluster is transcribed and marked with 5hmC in breast, whereas transcription and 5hmC appear absent in brain. Schematic representation of both the 5hmC and RNA-sequencing profile of the HOXA cluster is shown; the figure is adapted from the UCSC Genome Browser. Transcription values are given in reads per million (RPM).


