
Figure 6.
 of the 4721 genes with significant
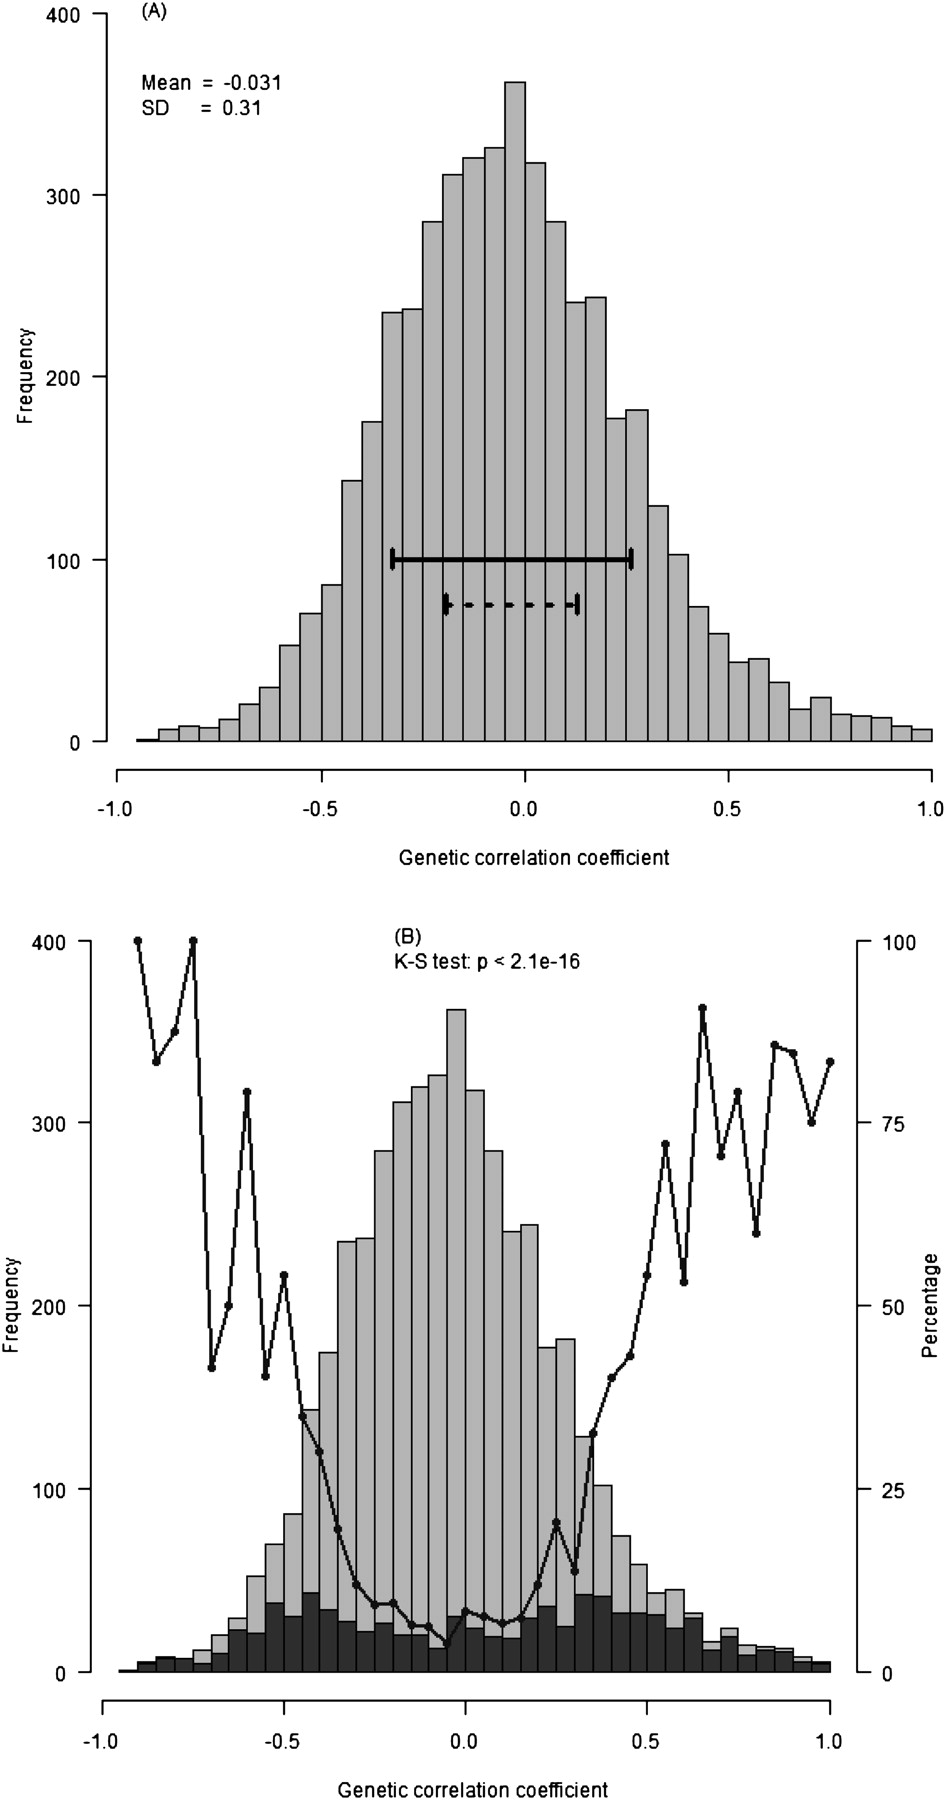
  in both LCL and WB samples. (A) (Solid line) ± one standard deviation from the mean
  ; (dashed line) ± one standard deviation calculated from the expected sample variance given
  and
and  . (B) The distribution of
  shown in A with the number of housekeeping genes (Zhu et al. 2008b) (see Results) within each
  bin shown in dark gray. The black line shows the percentage of genes within each
  bin that are housekeeping genes. We performed a Kolmogorov-Smirnov test for differences in the distributions of
  for housekeeping genes (dark gray) and non-housekeeping genes (light gray); the P-value is given in the figure.


