
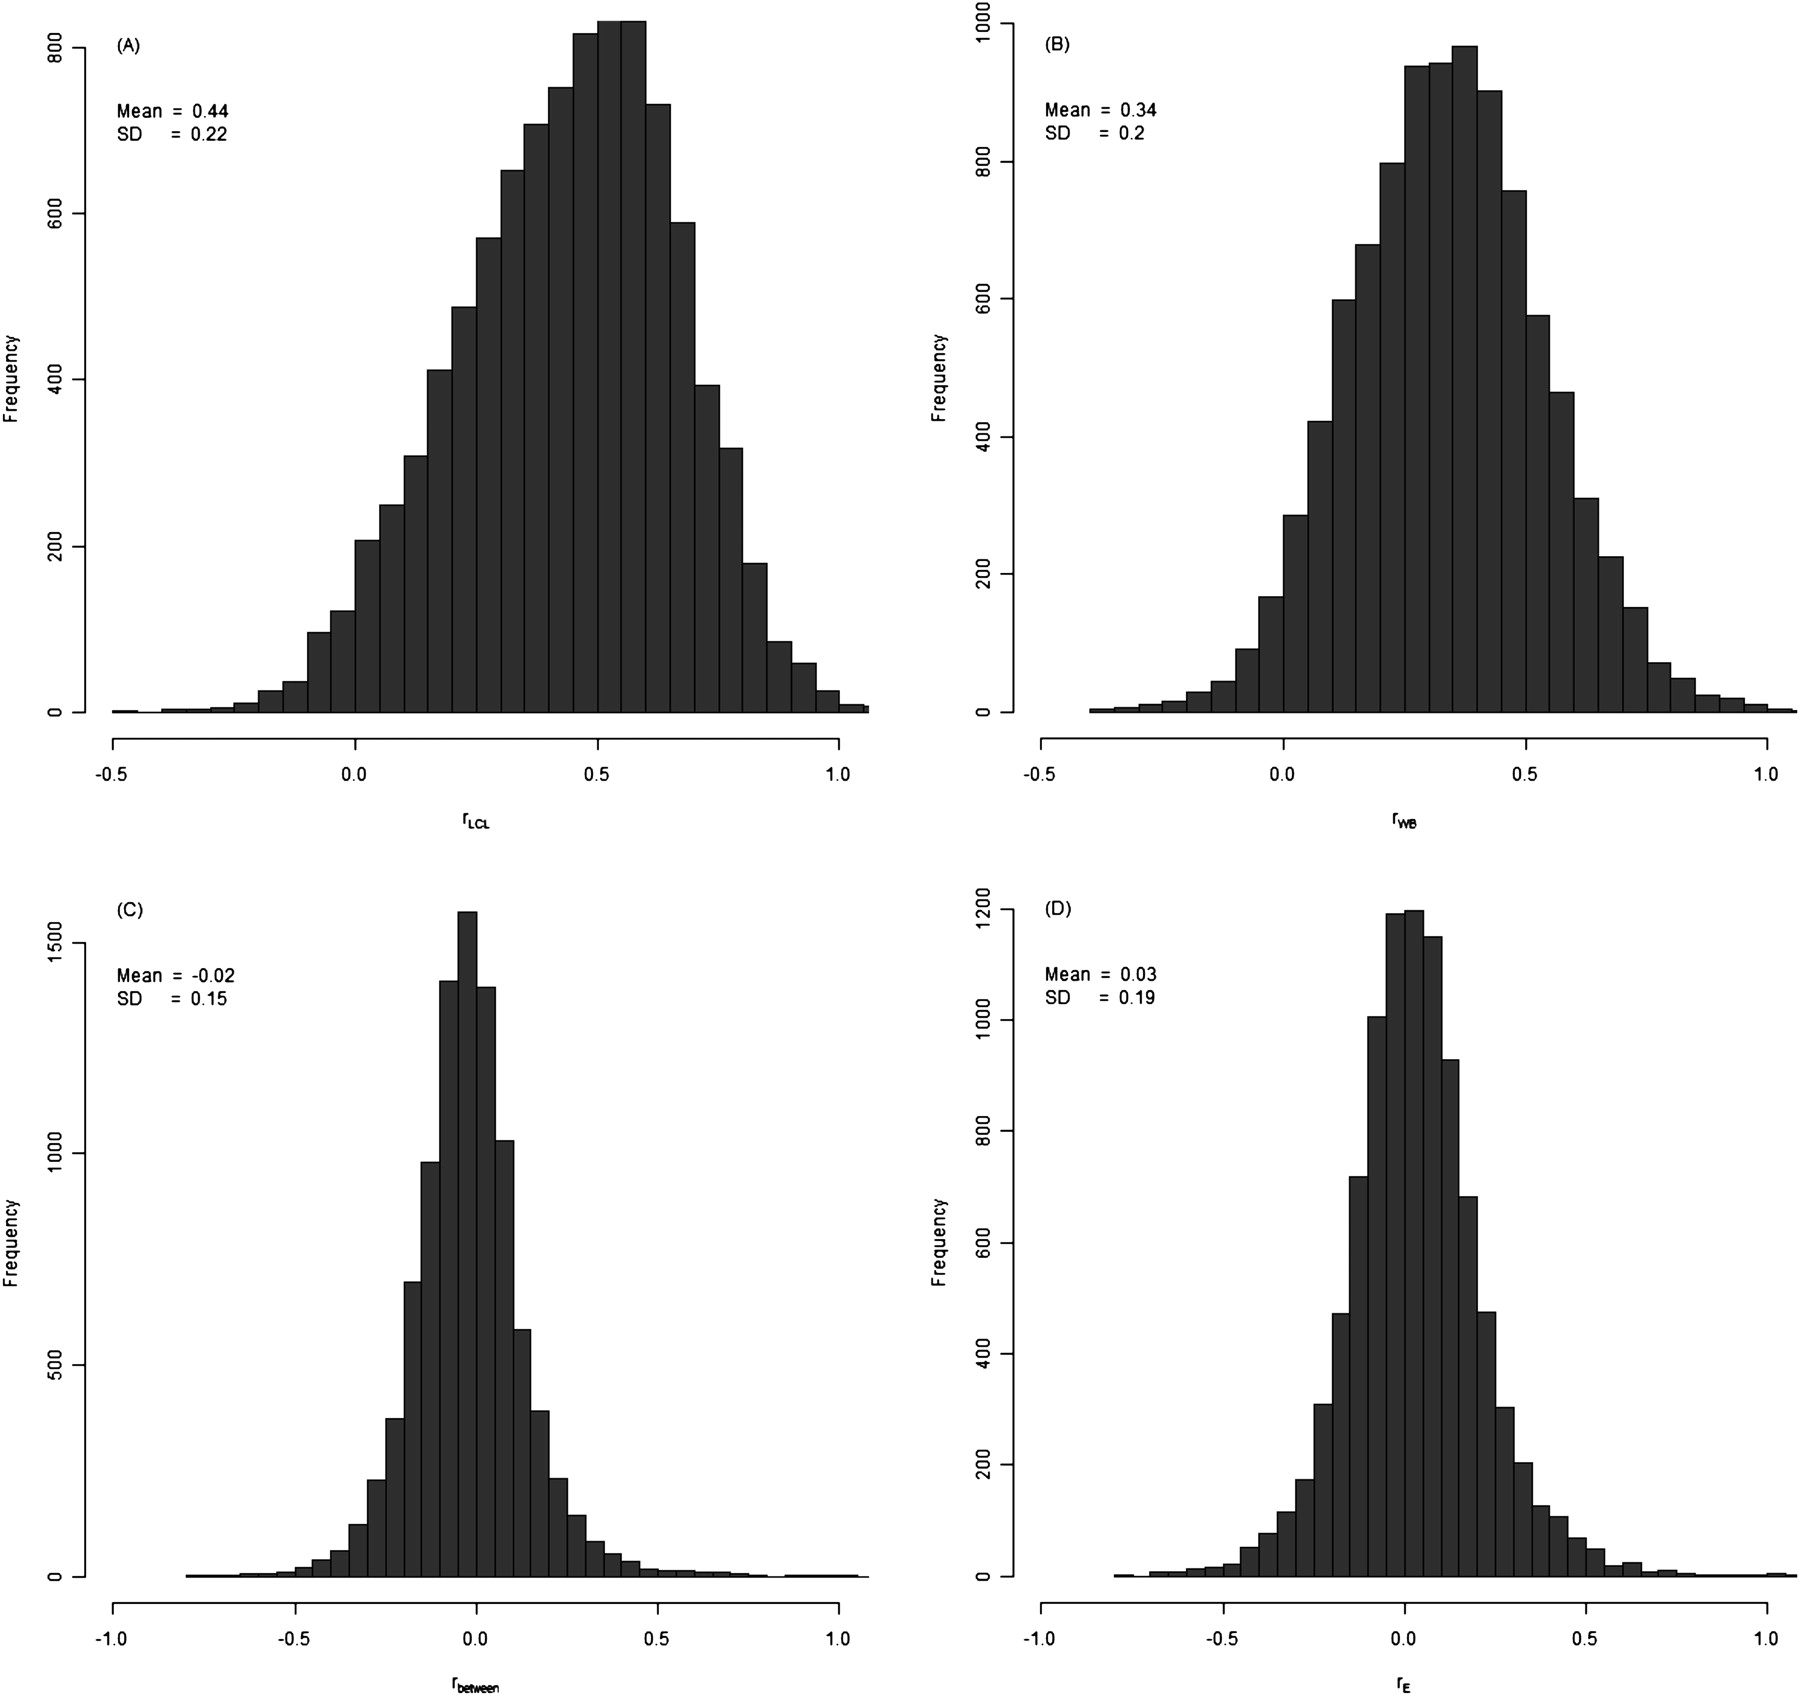
Figure 4.
Distributions between MZ twin phenotypic correlation coefficients of transcript abundance from 9555 genes significantly expressed in all samples. (A,B) Distributions of the correlation coefficients for rLCL and rWB samples, respectively. (C) Two measures of rbetween were calculated: one between the expression value for LCL in MZ_1 and WB in MZ_2 and a second between the expression value for WB in MZ_1 and LCL in MZ_2. The figure shows the distribution of mean of the two rbetween correlations. (D) The distribution of rE. The mean and variances of the distributions are given in each part.


