
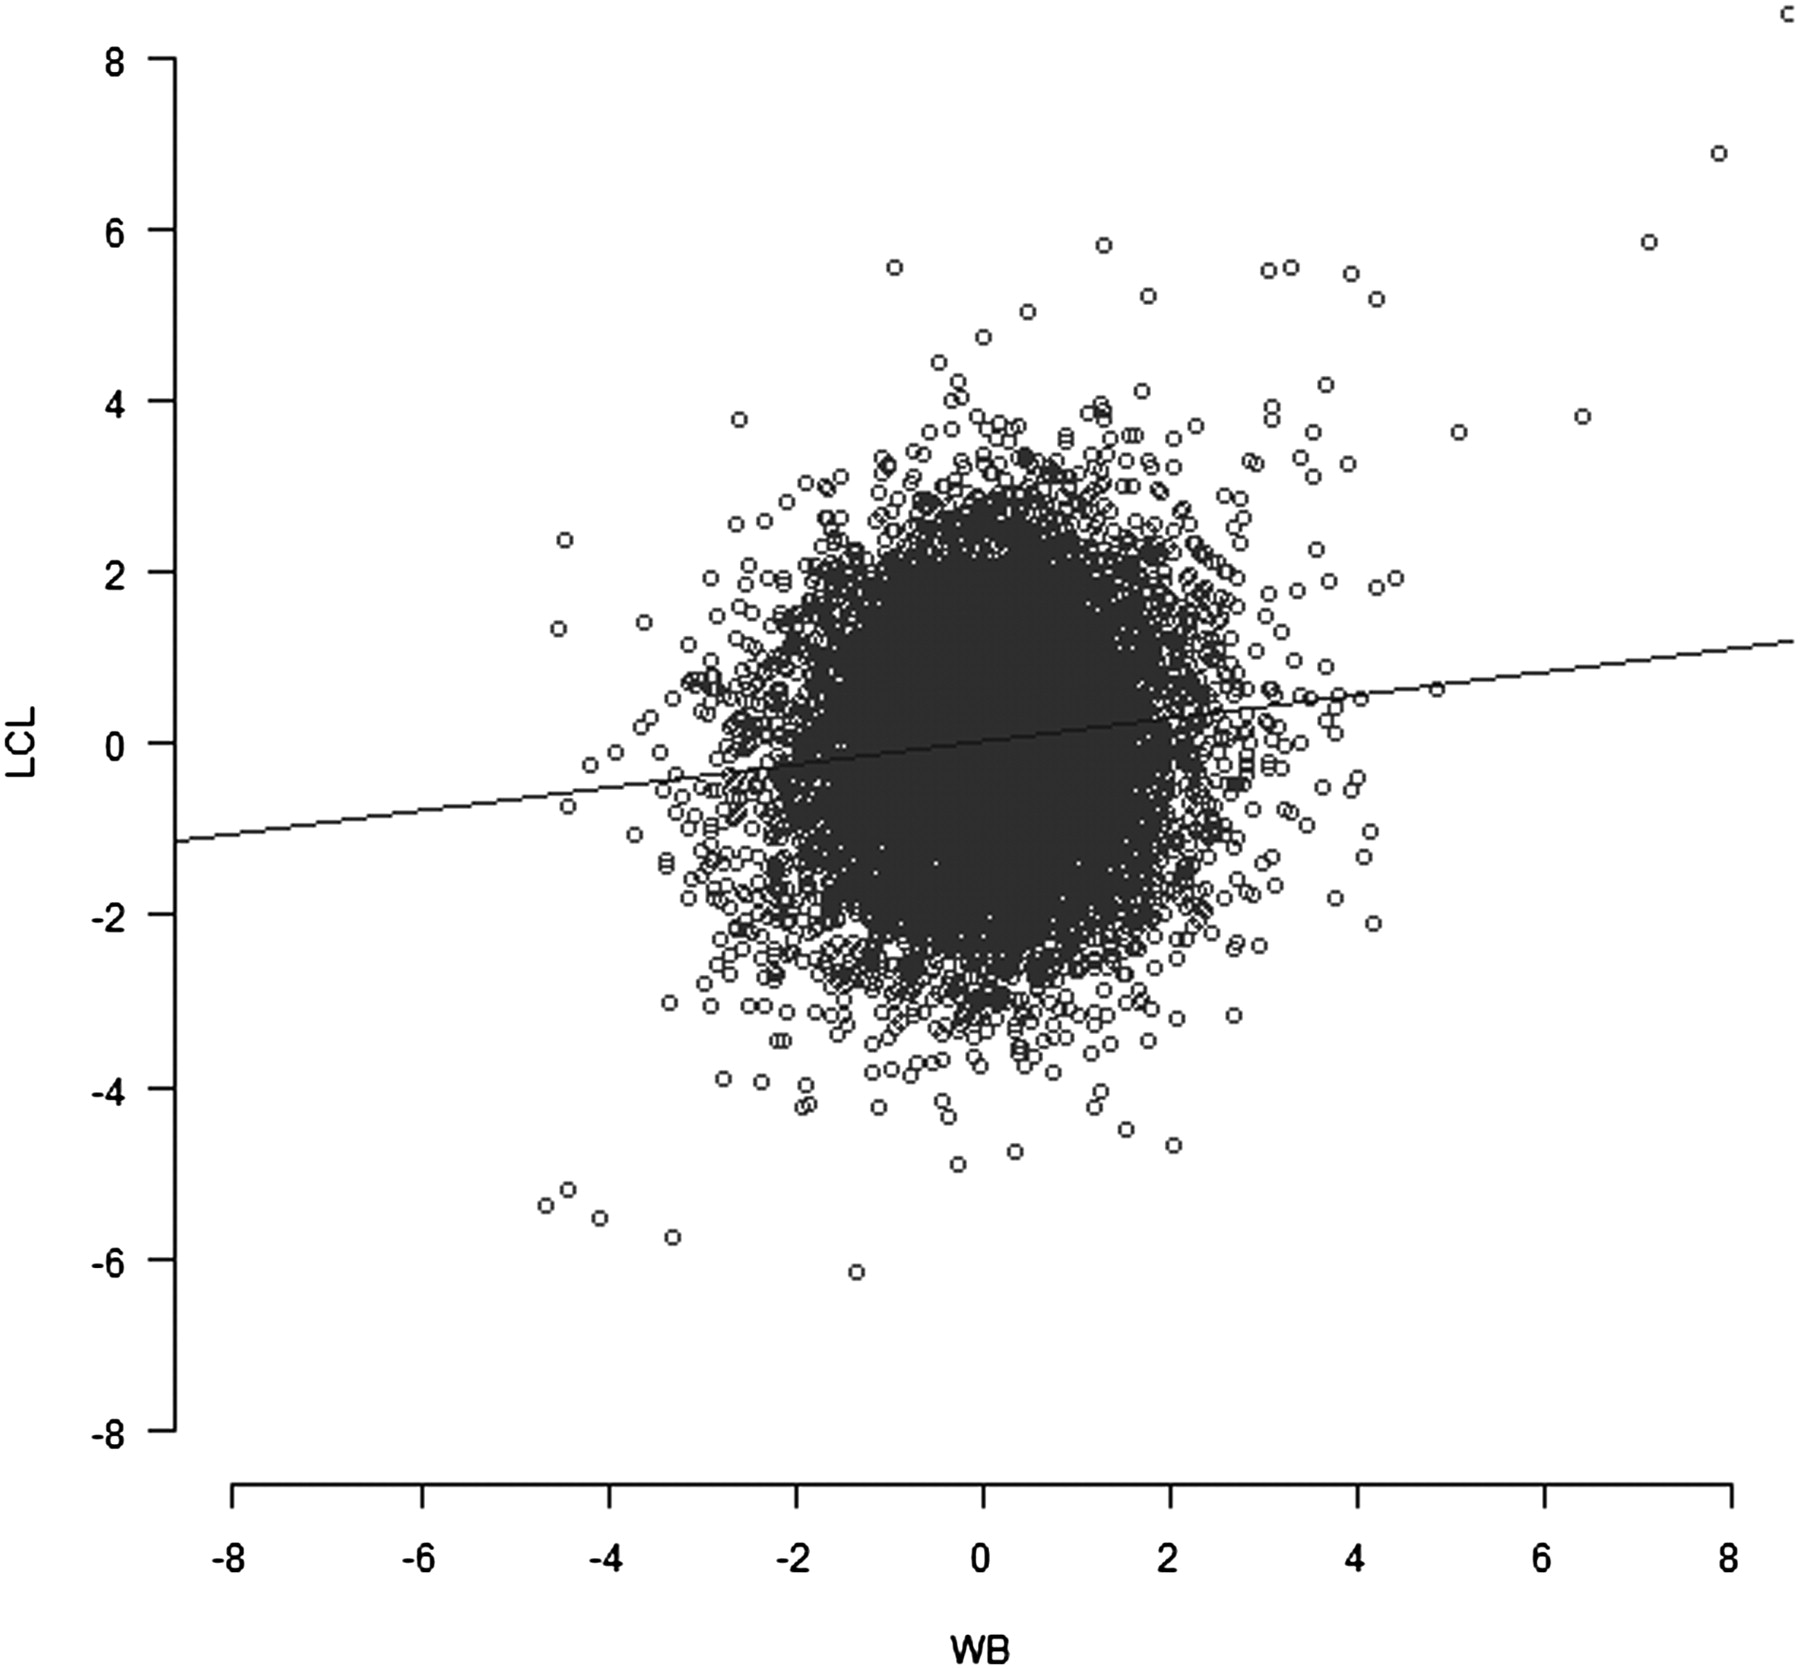
Figure 3.
Test statistics for the effect of sex on expression levels for 9555 genes in the WB and LCL samples. Each point represents a single gene. Regression coefficient = 0.13 with SE = 0.012 and correlation coefficient = 0.012.


