
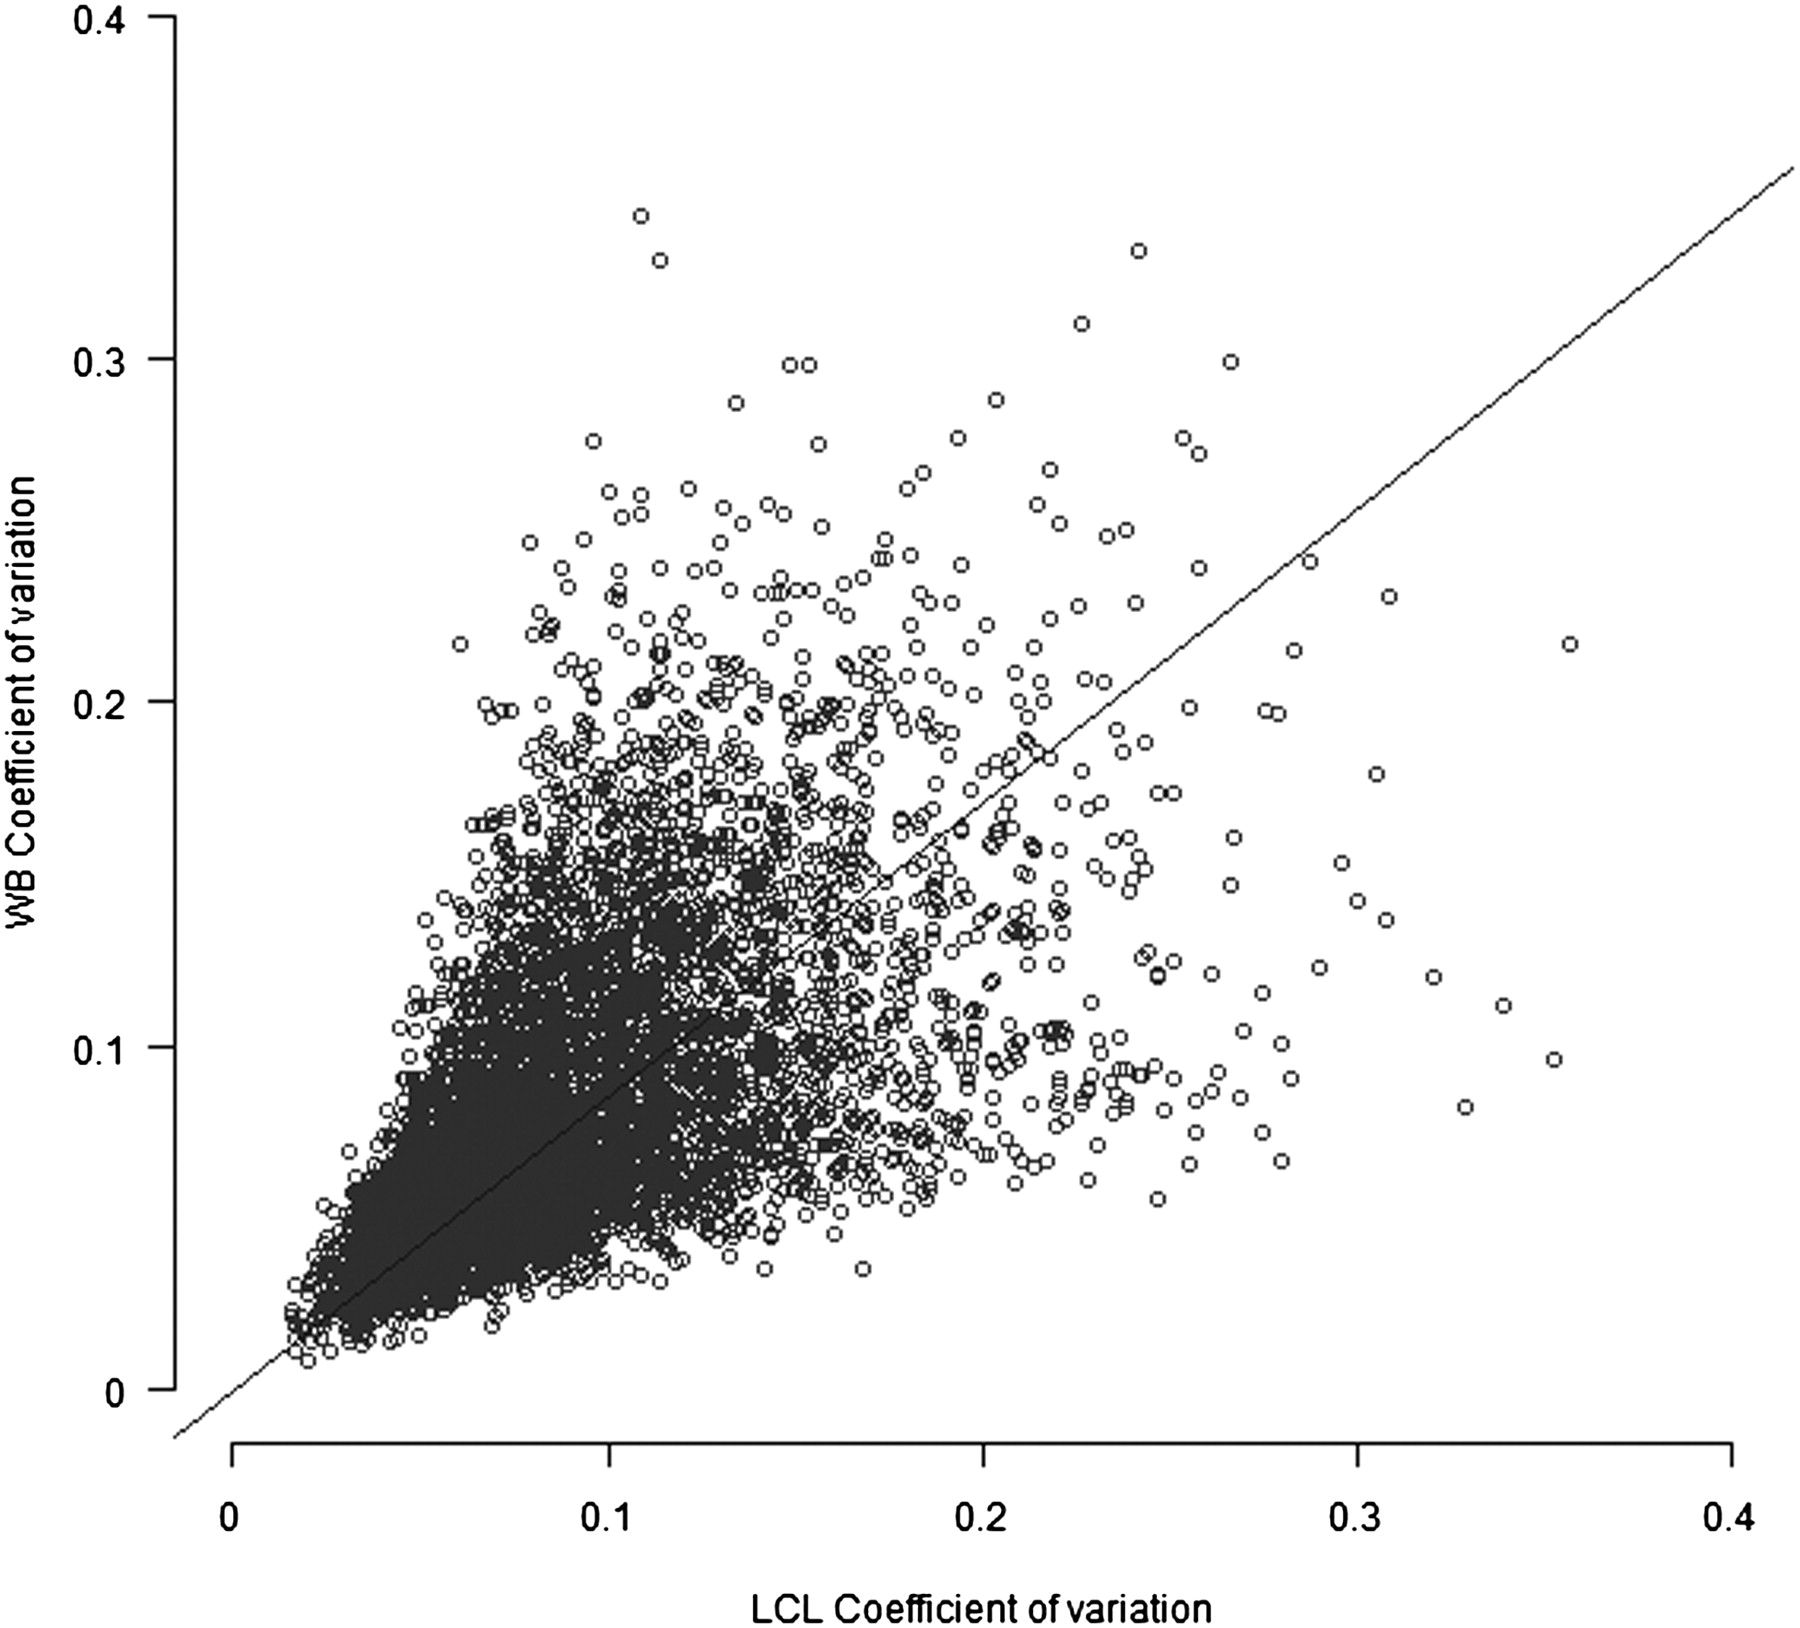
Figure 2.
Correlation of expression variability for 9555 genes between the LCL and WB samples. The coefficient of variation (cv) was calculated from the mean normalized gene expression values of MZ pairs. Each data point represents one gene. Regression coefficient = 0.96 with SE = 0.005 and correlation coefficient = 0.64.


