
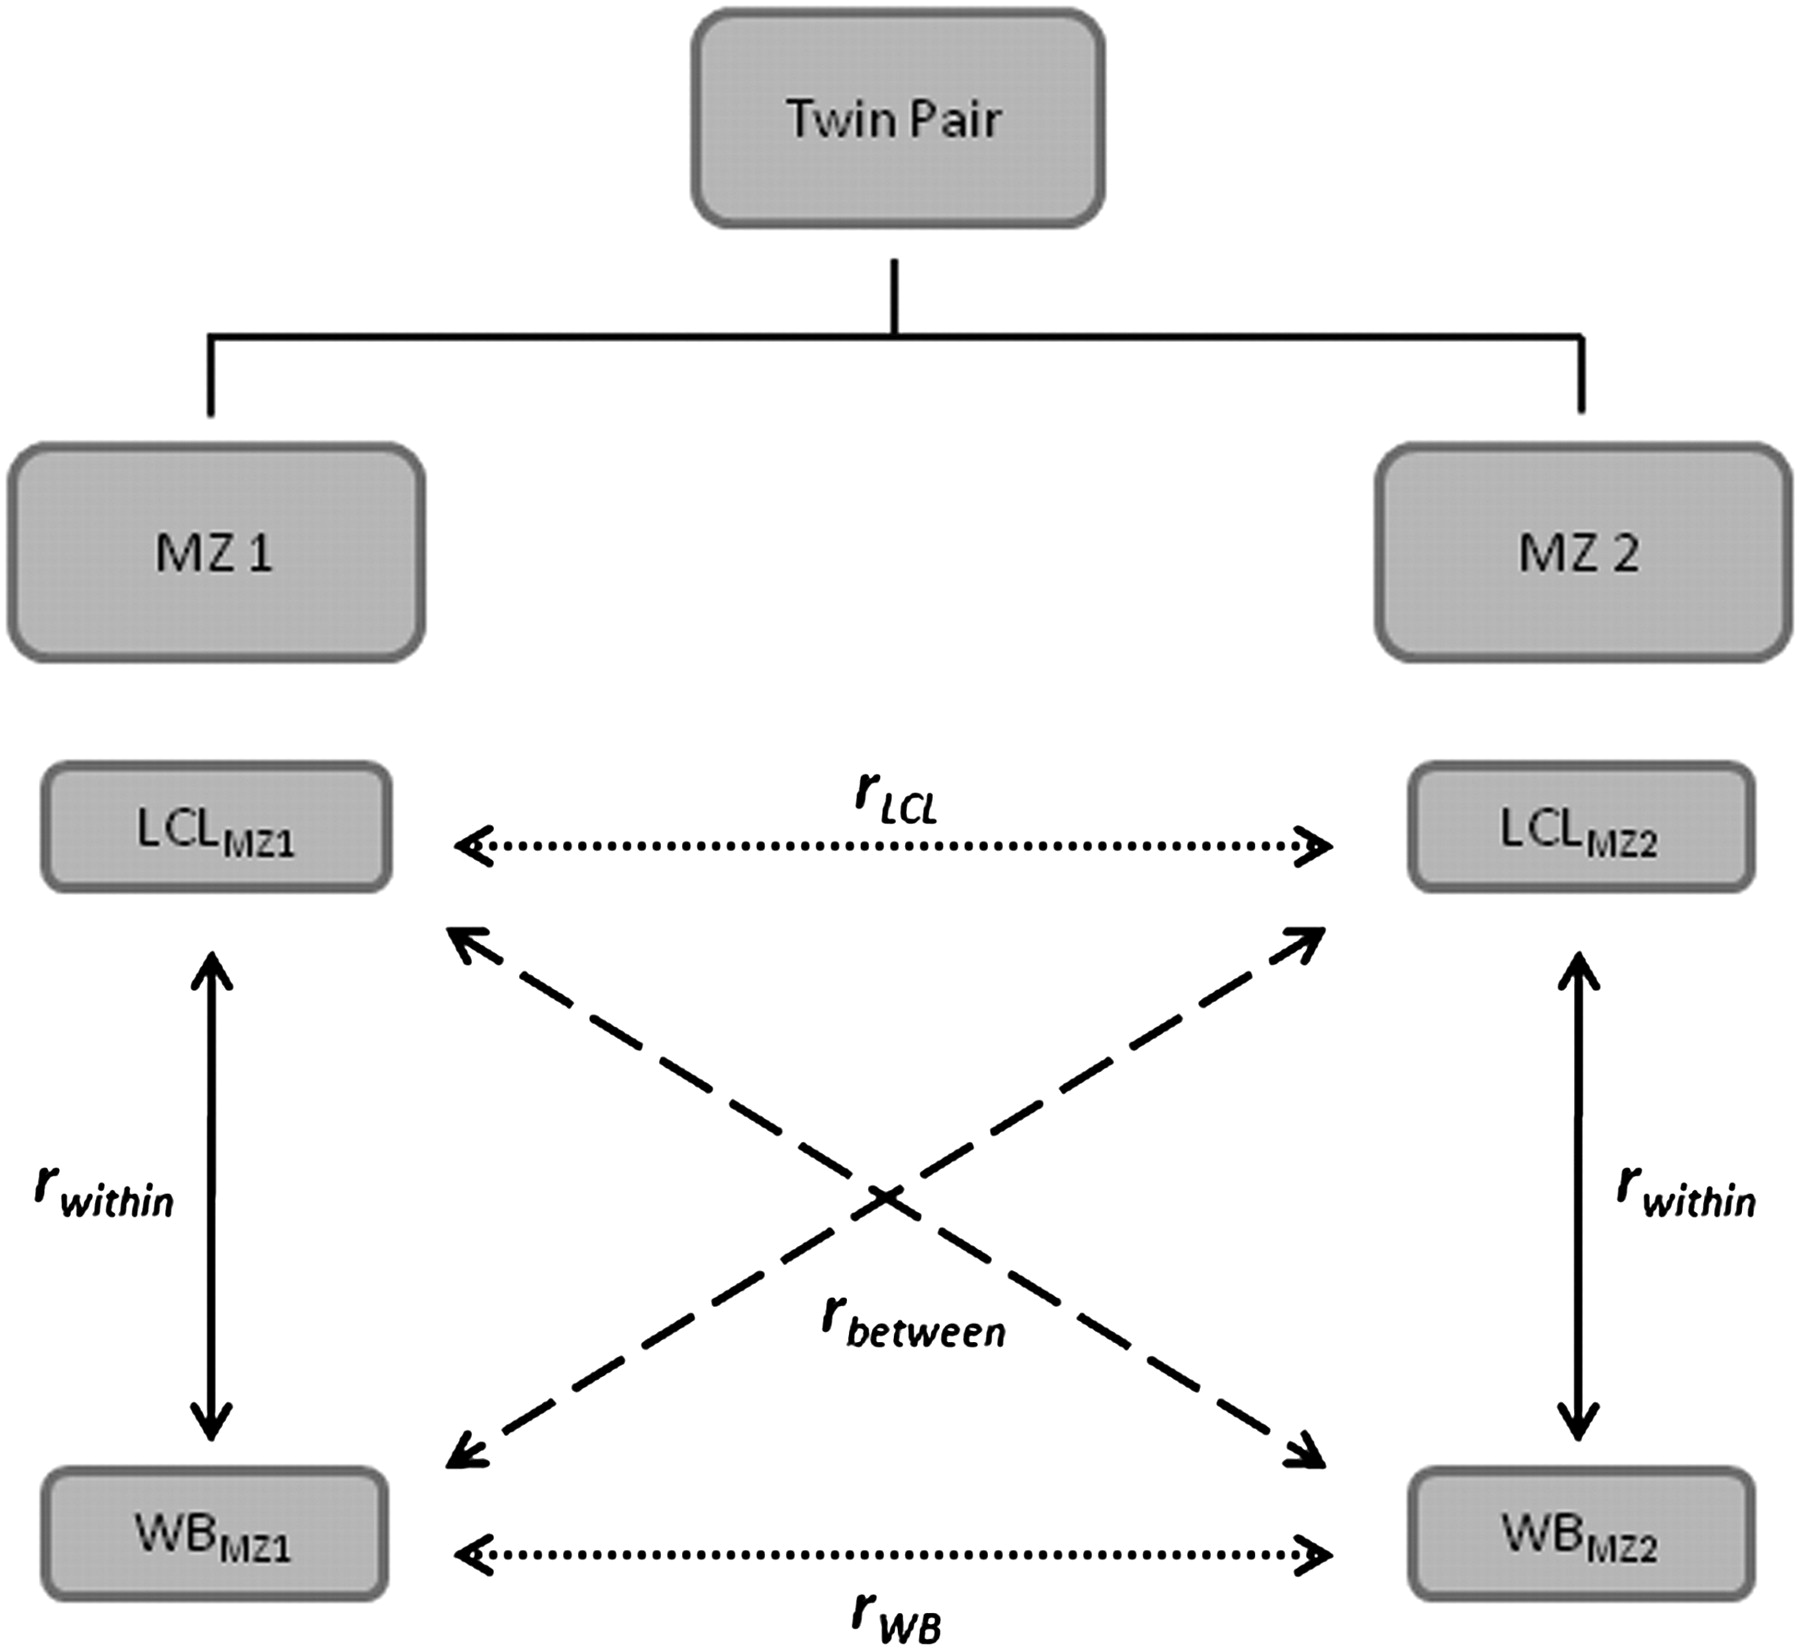
Diagram of study design. Gene expression levels were collected from two RNA sources, LCL and WB, from both twins within an
MZ pair. From this study design, we can calculate the following correlations: rLCL and rWB (dotted arrows) are the phenotypic correlations between MZ twins within RNA sources; rbetween (dashed arrows) is the phenotypic correlation between transcript abundance in LCL from a sample of one of an MZ twin pair
and the transcript abundance in WB from the sample of the co-twin. Under the assumption that there are no shared environmental
effects between twins, this correlation is a function of genetic effects only: rbetween = rGHWBHLCL, rwithin (solid arrows) is the phenotypic correlation of a RNA source within a sample. As the covariance of WB and LCL transcript
abundance in a sample can be due to shared genetic and/or shared environmental effects,  , where rE is the within sample correlation of environmental effects calculated as
  . These correlations are shown in Figure 4A–C and supporting material, respectively. This genetically informative study design provides a framework for estimating gene
expression
. These correlations are shown in Figure 4A–C and supporting material, respectively. This genetically informative study design provides a framework for estimating gene
expression  (dotted arrows) for each tissue, as well as genetic correlation
  (dashed arrows) of a gene's expression between the two RNA sources, by partitioning variance into within and between MZ components.


