
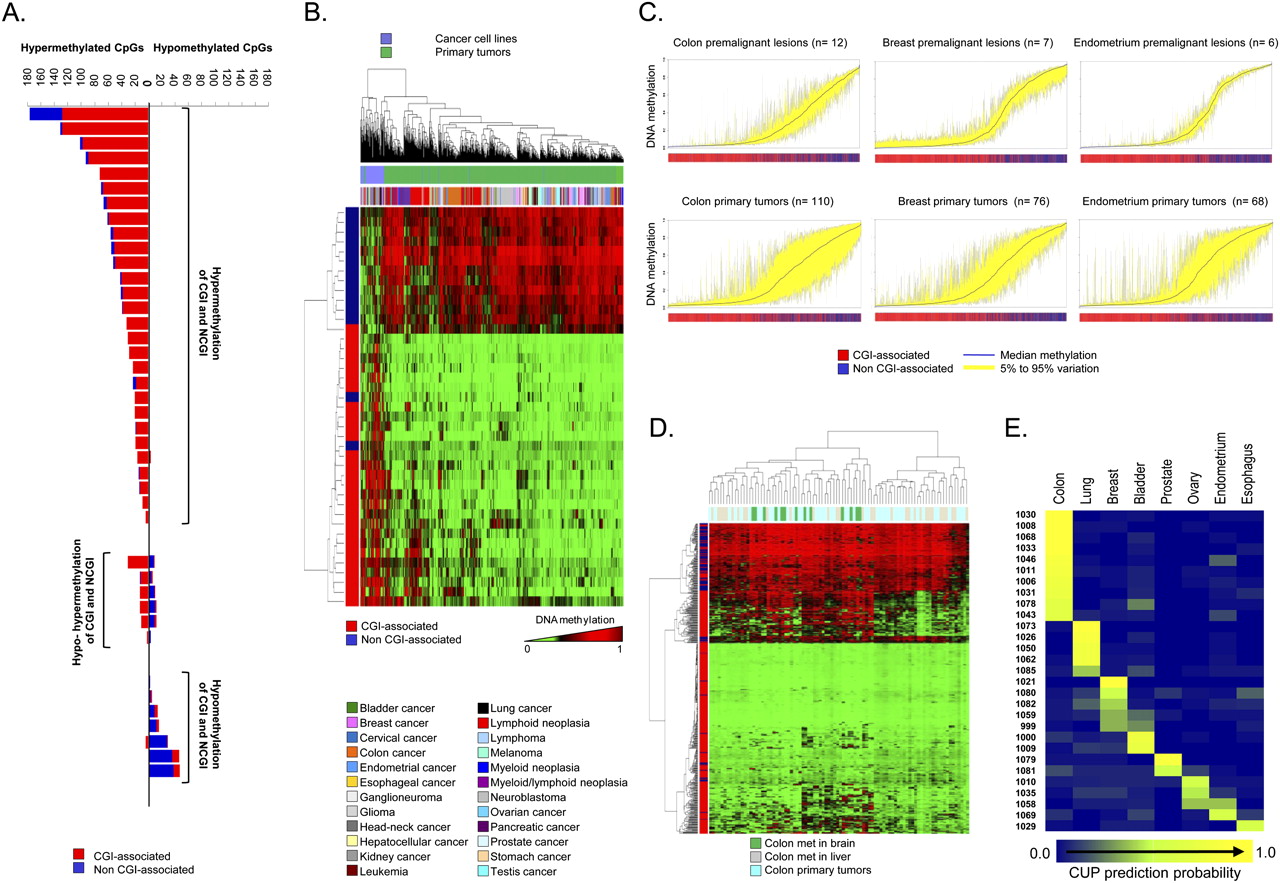
Scenarios of DNA methylation changes in human tumorigenesis. (A) Bart plot showing the CpG hypermethylation or hypomethylation changes observed when comparing paired normal–tumor tissues from the same colorectal cancer patient. They can be distinguished if the methylation change occurs in CpG island (CGI) or non-CpG island (non-CGI)–associated CpG. (B) Unsupervised hierarchical clustering and heatmap including a set of specific CpG sites that undergo differential DNA methylation only in cancer cell lines. (C) Deviation plot for the 1322 CpG sites shows greater CpG methylation heterogeneity (yellow area) in established tumors (colon, breast, and endometrial cancers) than in their corresponding premalignant lesions. (D) DNA methylation unsupervised clustering analyses and heatmap of primary tumors, local liver metastases, and distant brain metastases from the same colorectal cancer patient. A CpG methylation-specific pattern for brain metastases (green lanes) is observed. (E) CpG methylation prediction heatmap showing the CUP classification to a specific tumor type.


