
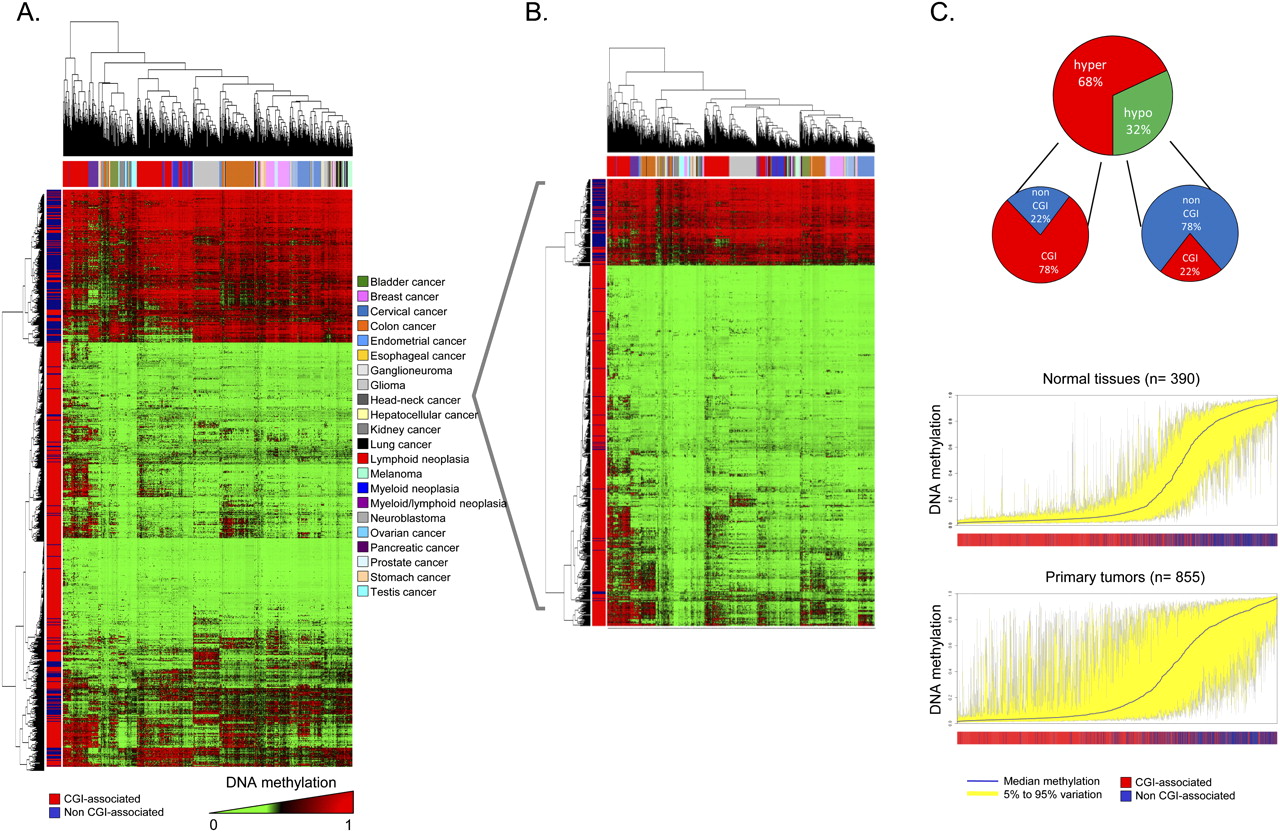
DNA methylation fingerprint of human cancer. (A) Unsupervised hierarchical clustering and heatmap showing distinction of primary tumor DNA methylation fingerprints according to the tissue of origin. (B) Unsupervised hierarchical clustering and heatmap of primary tumors excluding CpG sites with tissue-specific methylation. (C, above) Pie charts displaying the percentage of hypermethylated CpG sites (red) and hypomethylated CpG sites (green) in human malignancies, and their distribution in CpG islands (CGI in red) and outside CpG islands (non-CGI in blue). (Below) Deviation plot for the 1322 CpG sites showing the great methylation heterogeneity (yellow area) of primary tumors in comparison with normal primary tissues.


