
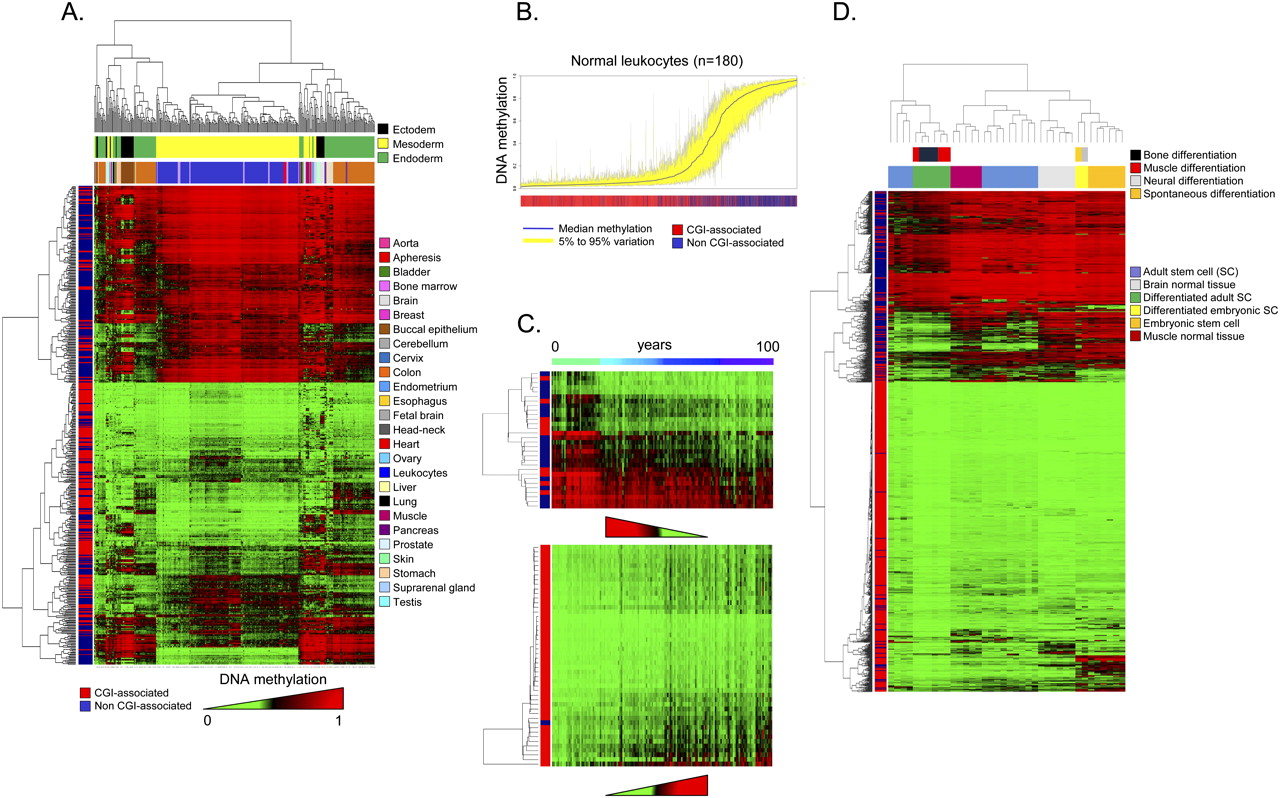
DNA methylation fingerprints for human normal tissues. (A) Unsupervised hierarchical clustering and heatmap including CpG dinucleotides with differential DNA methylation encountered between different normal primary samples. Tissue type and development layers are displayed in the different colors indicated in the figure legends. Average methylation values are displayed from 0 (green) to 1 (red). (B) Deviation plot for the 1322 CpG sites studied in leukocyte samples showing that little CpG methylation heterogeneity (yellow area) occurs overall at CpG sites within CpG islands (red lines in the track below), while more differences in CpG methylation are observed outside CpG islands (blue lines in the track below). (C) Unsupervised hierarchical clustering and heatmap including sets of genes with high correlation values between hypomethylation (up) and hypermethylation (down) with aging. (D) Unsupervised hierarchical clustering and heatmap showing the DNA methylation patterns of embryonic and adult stem cells, comparing them with corresponding normal and differentiated tissues (muscle, bone, and neuron; and muscle and brain, respectively).


