
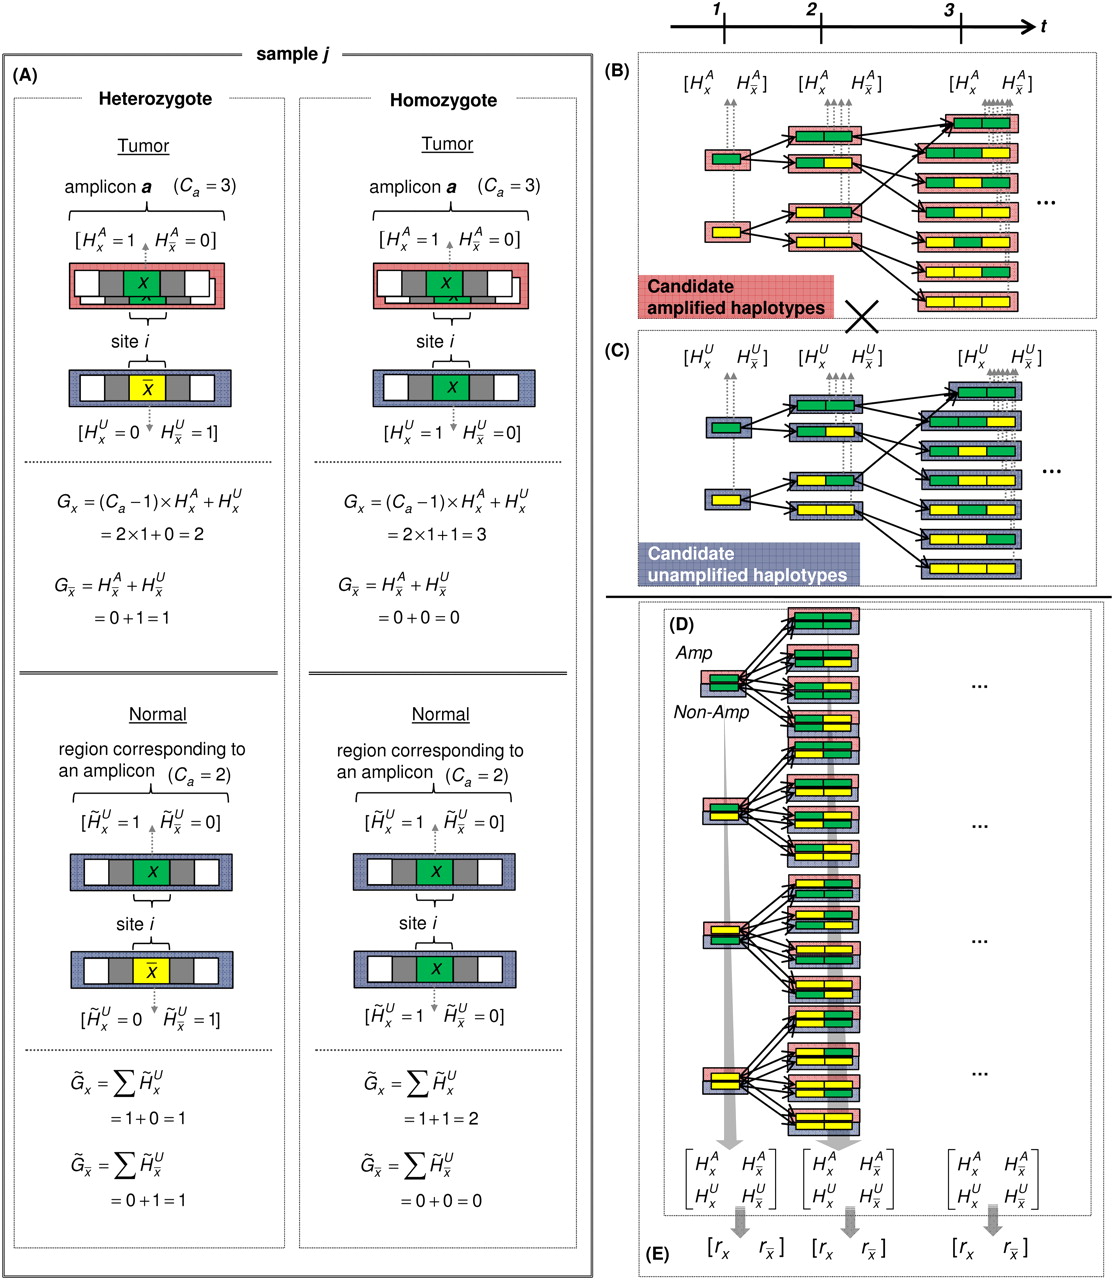
Parameter definition depictions, haplotype, genotype, and integrated HMM. The left half of the figure depicts the definitions of several model parameters, while the right half depicts examples of the four HMM models. (A) Model parameters are depicted for a heterozygous or homozygous site i in tumor and matched normal tissues for sample j. For a particular genotype call within a tissue, a diagram of the call is depicted, along with the corresponding H and G parameters. For example, for a heterozygous call within a tumor, the amplicon a (containing i) from the tumor is shown, depicting the amplified haplotype (with allele x amplified) within the red frame and nonamplified haplotype (allele  ) within the blue frame. The haplotypes emit their respective H values per site, followed by the definitions of the G values for each allele. Both H and G should be additionally subscripted by i and j formally, but these subscripts are excluded for simplicity's sake. For the amplified haplotype in red,
  = 1 since x is present (and amplified), while
  = 0 since
  is not present within that haplotype at i. For the nonamplified haplotype in blue,
  = 1 since
  is present (and not amplified), while
  = 0 since x is not present within that haplotype at i. (B) Example of the haplotype HMM for the amplified haplotype. Each state contained within a red frame represents a candidate
amplified haplotype. Green boxes represent x while yellow boxes represent
= 0 since x is not present within that haplotype at i. (B) Example of the haplotype HMM for the amplified haplotype. Each state contained within a red frame represents a candidate
amplified haplotype. Green boxes represent x while yellow boxes represent  . The H symbols emitted from a state correspond to the last allele in the haplotype represented by the state, as depicted by the
dotted vertical arrows. The haplotype lengths generally grow from left to right due to addition of an allele at the current t. Note that at t = 3, most states represent haplotypes of length 3, with the exception of the topmost state, which represents a haplotype
[green | green] of length 2. This haplotype merges two 3-SNP haplotypes [green | green | green] and [yellow | green | green]
because they both are singletons in the training data. Both states [green | green] and [yellow | green] at t = 2 thus transition to state [green | green] at t = 3. (C) Haplotype HMM for the nonamplified haplotype. Note that it is identical to B except for the differing emitted symbols. (D) Genotype HMM that is the cross-product of the haplotype HMMs. For each pair of haplotypes, the amplified haplotype is depicted
above the nonamplified haplotype within red and blue frames, respectively. Each pair of haplotypes inherits the H values from their respective haplotype HMMs. (E) Translated HMM upon incorporating the model data. Note that while the structure remains unchanged, the emitted symbols are
translated from the H values to the read counts. The rx variables should also include subscripts i and j for formal correctness, which were omitted here for simplicity's sake.
. The H symbols emitted from a state correspond to the last allele in the haplotype represented by the state, as depicted by the
dotted vertical arrows. The haplotype lengths generally grow from left to right due to addition of an allele at the current t. Note that at t = 3, most states represent haplotypes of length 3, with the exception of the topmost state, which represents a haplotype
[green | green] of length 2. This haplotype merges two 3-SNP haplotypes [green | green | green] and [yellow | green | green]
because they both are singletons in the training data. Both states [green | green] and [yellow | green] at t = 2 thus transition to state [green | green] at t = 3. (C) Haplotype HMM for the nonamplified haplotype. Note that it is identical to B except for the differing emitted symbols. (D) Genotype HMM that is the cross-product of the haplotype HMMs. For each pair of haplotypes, the amplified haplotype is depicted
above the nonamplified haplotype within red and blue frames, respectively. Each pair of haplotypes inherits the H values from their respective haplotype HMMs. (E) Translated HMM upon incorporating the model data. Note that while the structure remains unchanged, the emitted symbols are
translated from the H values to the read counts. The rx variables should also include subscripts i and j for formal correctness, which were omitted here for simplicity's sake.


