
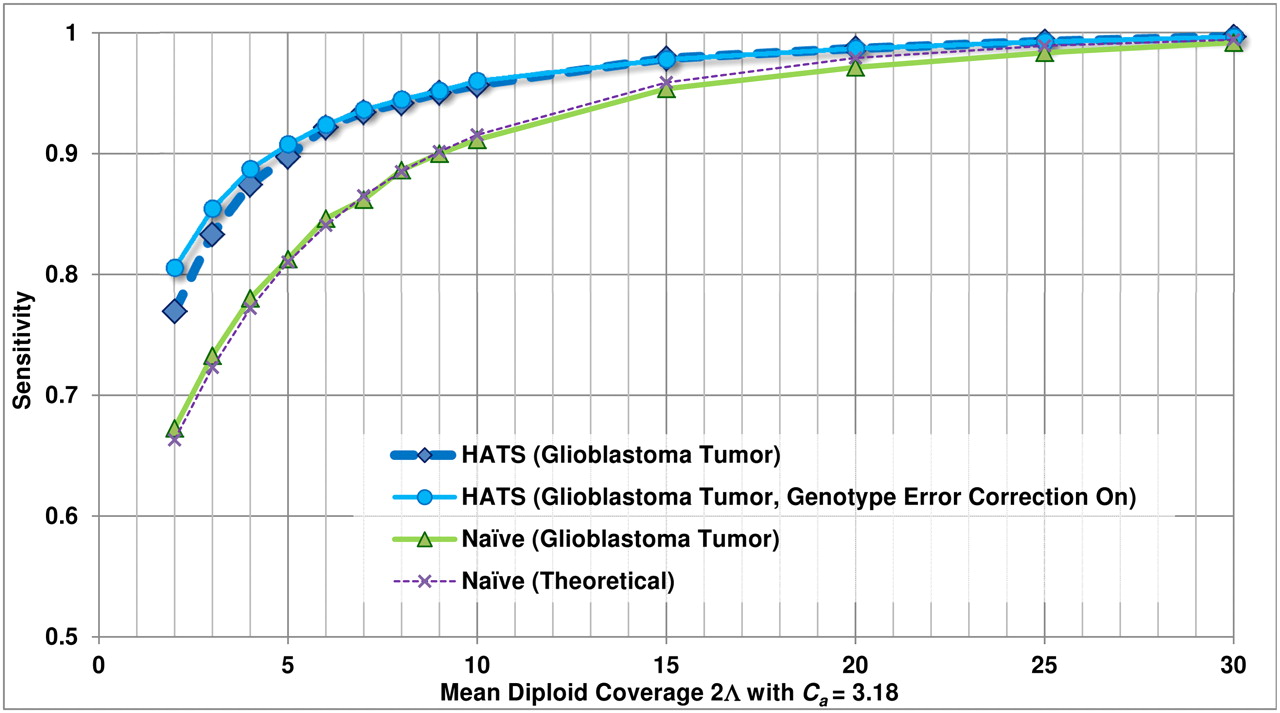
Empirical sensitivity of HATS and the naive model, TCGA glioblastoma sample (TCGA-06-0877), Chr 19. This figure displays the sensitivity results for HATS and the naive method on an amplified region (chromosome 19: 2,181,615–2,541,253) in a glioblastoma patient (TCGA-06-0877) obtained from TCGA with a local copy number of 3.18. The naive theoretical curve is included for comparison purposes. The gold-standard amplified alleles were obtained by analyzing the region with the naive method using high coverage (33.7×) read counts, as simulations for a copy number of 3 indicated high sensitivity for the naive method at high coverage levels. The read counts were randomly down-sampled to result in varying coverage levels as displayed on the x-axis (with 100 trials of down-sampling performed per coverage level). The down-sampled read counts were passed to both HATS and the naive method. The reported amplified alleles were compared with the gold standard to indicate sensitivity. Note that for higher coverage levels, the performance of both HATS and the naive method is strong, which is expected as this was observed in the simulations. As coverage decreases, HATS maintains a marked performance improvement over the naive method. Tumor alignment files and copy number data for this patient were obtained from TCGA (see Methods: Input data specifications).


