
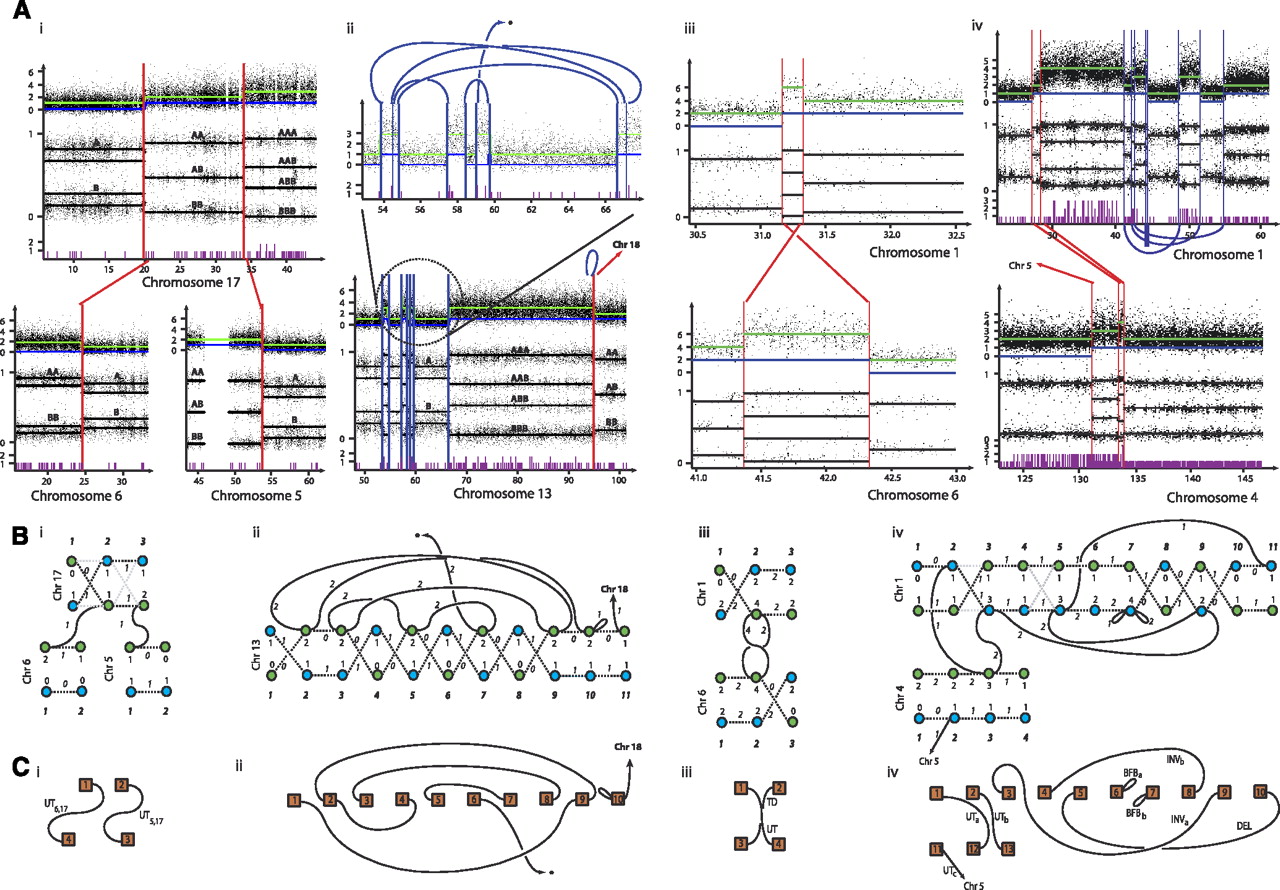
Copy number segment connectivity. Here we display copy number segmentation, rearrangement data, and single-nucleotide mutation data for four sets of rearrangements. The first two (i and ii) involve primary breast cancer sample PD3904, iii and iv involve cell lines HCC1187 and NCI-H209, respectively. Each chart in A presents the output from the PICNIC segmentation algorithm, the upper plot being total copy number and the central plot representing genotype intensity. (The lower plot) Single-nucleotide mutations. (Green) Total copy number; (blue) minor copy number. (Blue) The intra-chromosomal rearrangements; (red) inter-chromosomal rearrangements. (B) Allelic graphs for each rearrangement cluster. (Gray lines) Alternative graph topologies. The blue and green node colors highlight individual parental chromosomes. (C) Somatic graphs for the clusters. Each component represents a transformation, the type indicated with a label. The acronyms are defined in Figure 2.


