
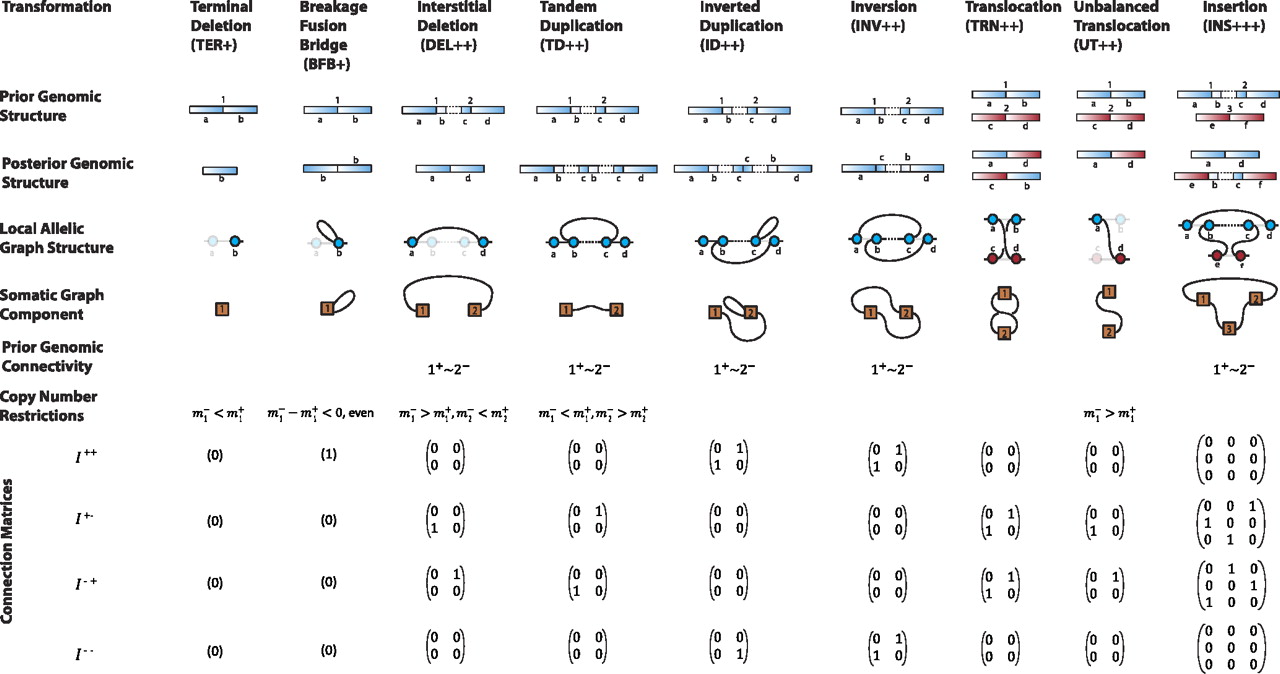
Transformation dictionary. A description of the effects for nine transformation classes named in the header row. The first
and second rows describe the change in the genome. The third row highlights the allelic graph structure. The fourth row gives
the corresponding somatic graph component. The fifth row describes genomic connectivity prior to the transformation. The sixth
row describes the copy number profiles following the transformation. The remaining rows give the connection matrices. The
signs associated with transformations indicate the orientation of the genome at breakpoints. All information is displayed
for breakpoints arising in wild-type (non-inverted) regions of the genome.  represent copy numbers for segments to the left and right side of breakpoint i.
  indicates that the right side of breakpoint i must be genomically connected to the left side of breakpoint j prior to the transformation.
  indexes rearrangement between breakpoints i and j, where Si and Sj are the genomic orientations at the breakpoints.


