
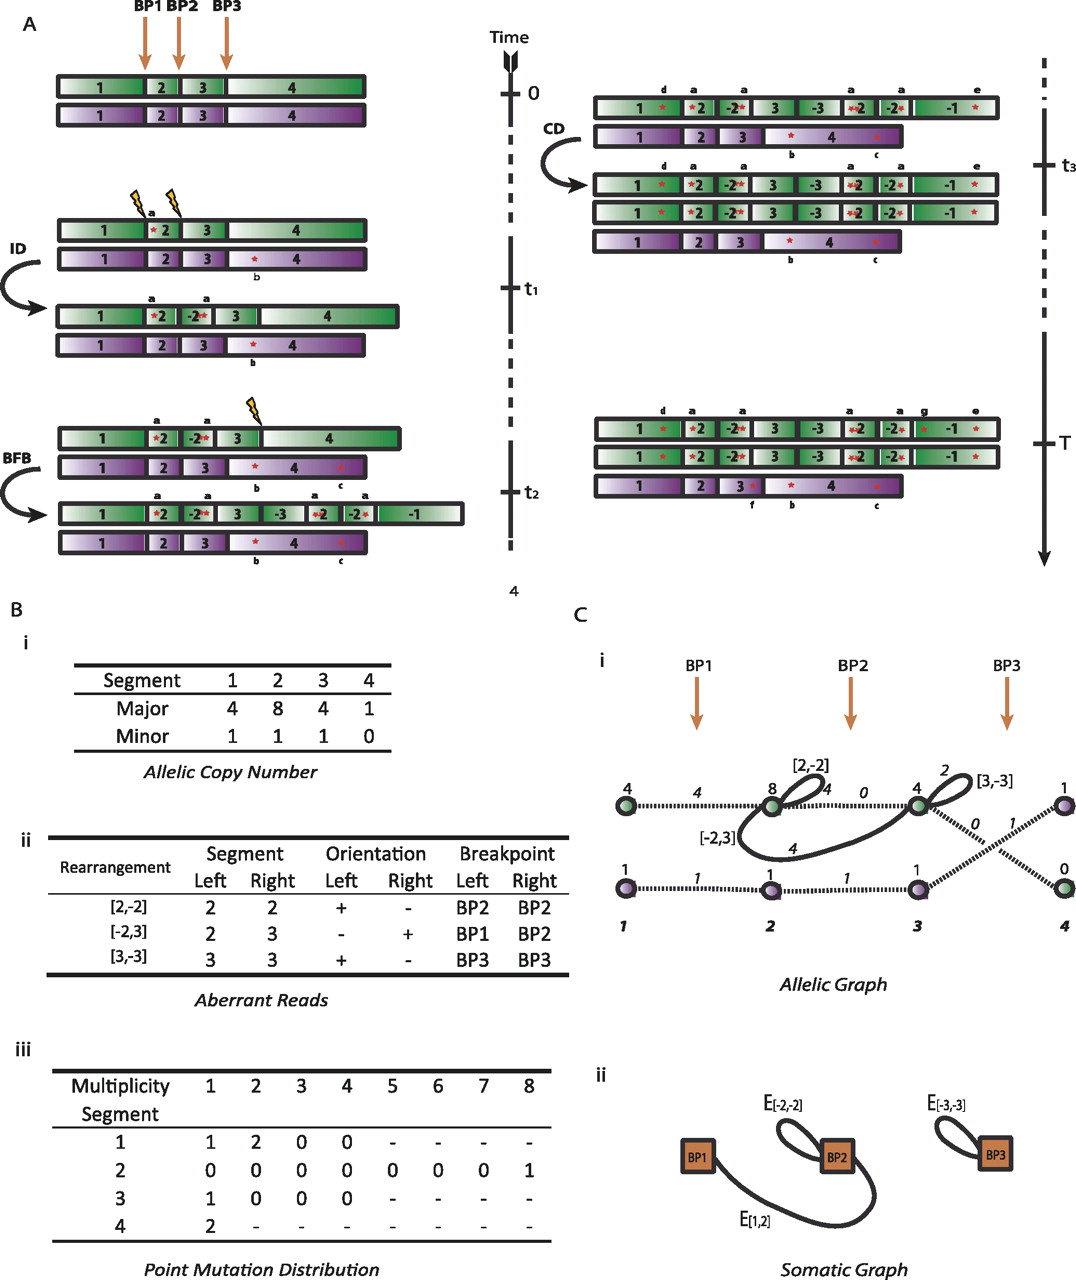
Genome evolution. Here we describe an example portion of the genome undergoing somatic rearrangement. (A) The evolution of the region through time, subject to three rearrangements—an inverted duplication, a breakage-fusion-bridge cycle, and a chromosomal duplication. (Green and purple) The parental alleles. The numbers indicate the segmental regions, a negative sign meaning a segment is in reversed orientation. (Red stars) Single-nucleotide mutations, a, b, …, g. (B) The observables. (i) Contains allelic integer copy numbers, counting each parental segment. (ii) Contains rearrangement data; the two segments forming the left and right connection are indicated, the negative sign indicating reversed orientation, along with the breakpoints involved by each segment. (iii) The distribution of single nucleotide mutations; the number in row s and column m counts the number of mutations in segments numbered s with multiplicity m. (C) Graphical representations of these data. (i) The allelic graph, representing the segments and their connectivity. Each node represents an allele of a segmented region; the numbers on nodes are major and minor copy numbers. Each black solid (curved) edge represents a rearrangement between two segments; the numbers on the edge represent the number of genomic copies of the connection. Each dotted black edge indicates a germline connection between two consecutive segments. The horizontal direction of each end of each edge indicates the side of the segment that is attached. (ii) The somatic graph. Each node represents a somatic breakpoint. Each edge connects two nodes, representing a rearrangement implicating the two associated breakpoints. Each end is attached to the side of the breakpoint the rearrangement involves.


