
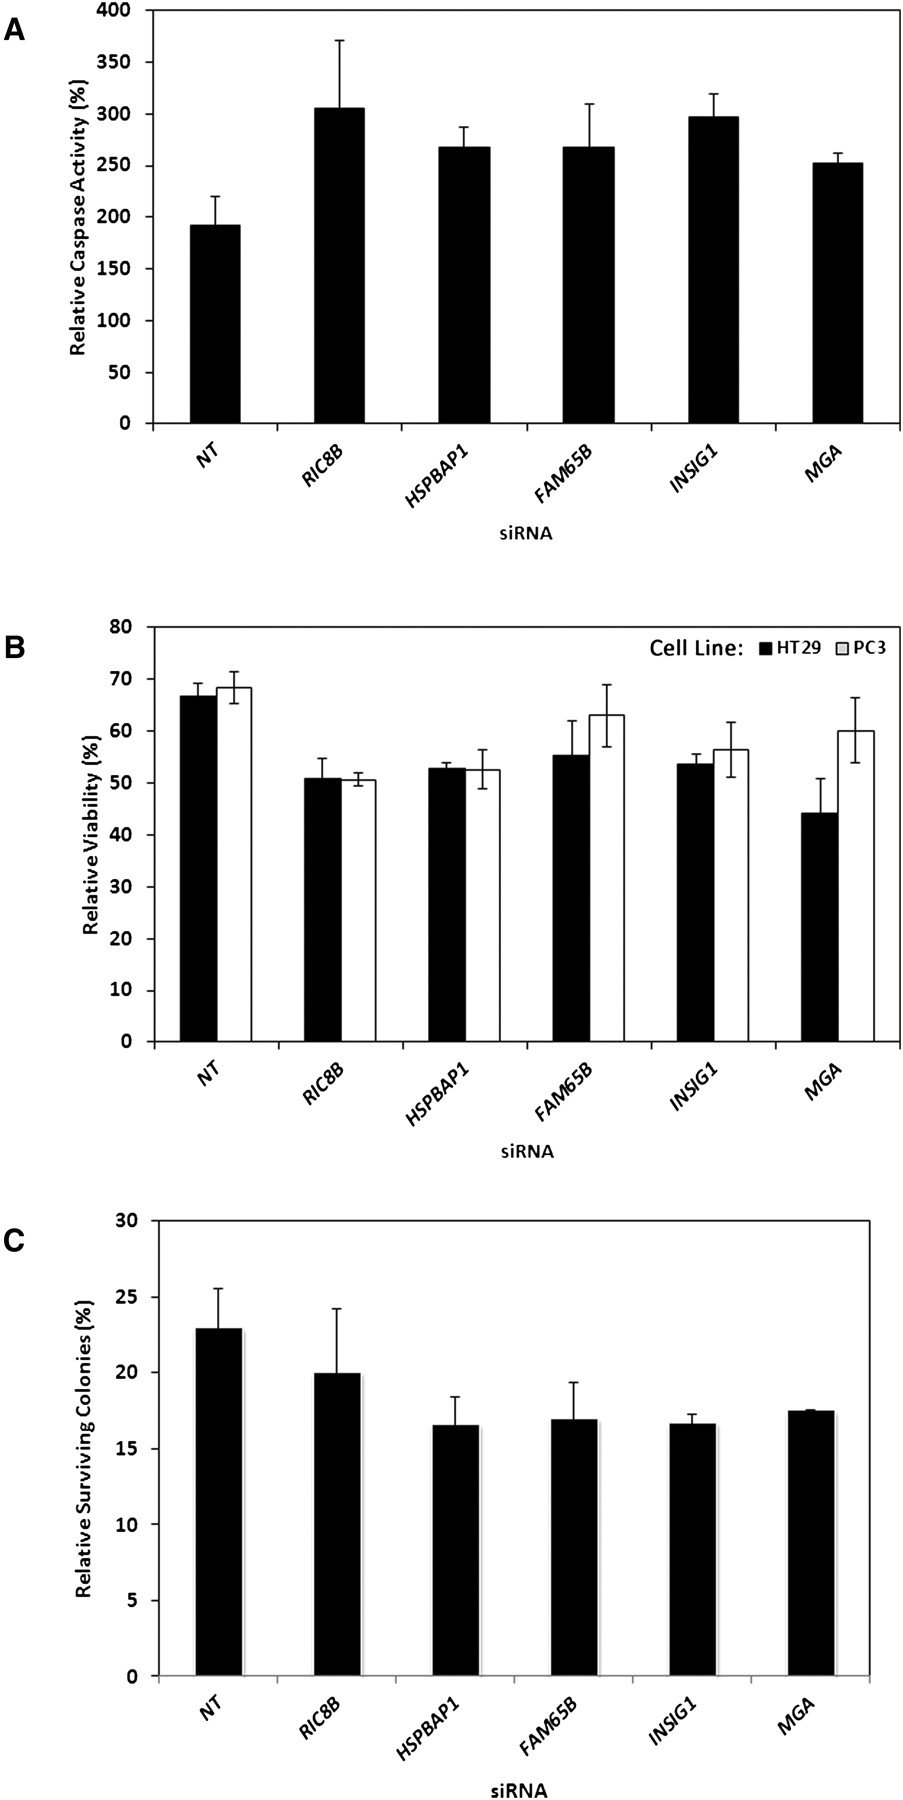
Figure 3.
Increased radiation-induced cell death following gene knockdown. After siRNA transfection and exposure to radiation, various measurements were made in different cell types: (A) relative changes in caspase 3/7 activity in cultured B cells; (B) relative changes in cellular viability by MTS assay in colorectal cancer cells, HT29 (black bars), and in prostate cancer cells, PC3 (white bars); and (C) relative changes in cellular viability by colony-formation assay in colorectal cancer cells, HT29. Data are shown as mean ± SEM of two or more independent transfections (for raw data, see Supplemental Tables S4, S5).


