
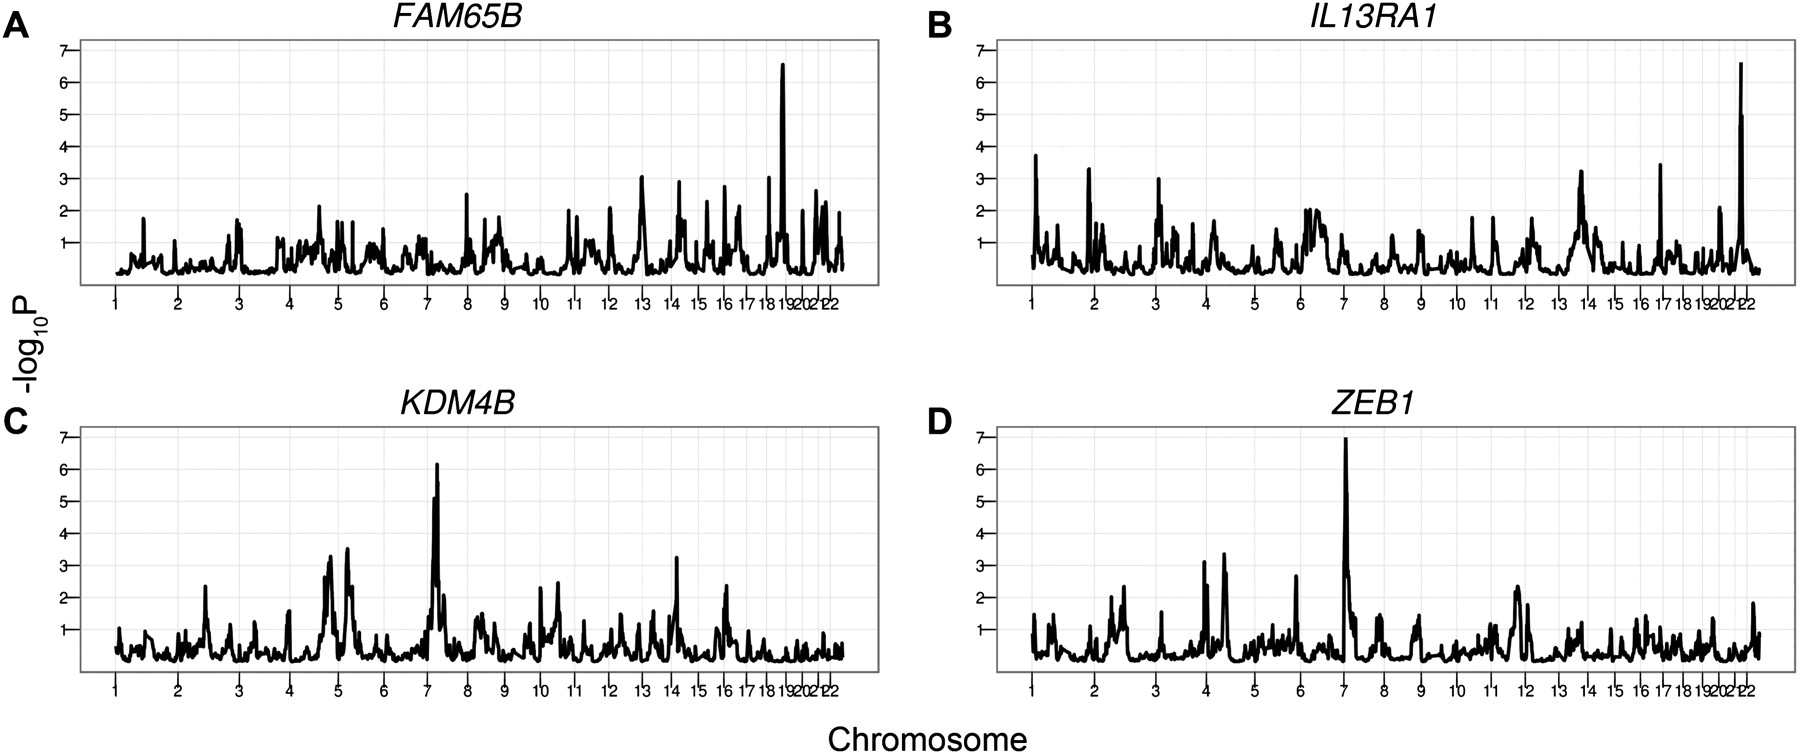
Figure 2.
Linkage results of four IR-responsive genes whose expression levels correlate with cell death. (A–D) Chromosomal location is plotted on the horizontal axis with evidence of linkage represented by P-value (−log10) on the vertical axis.


