
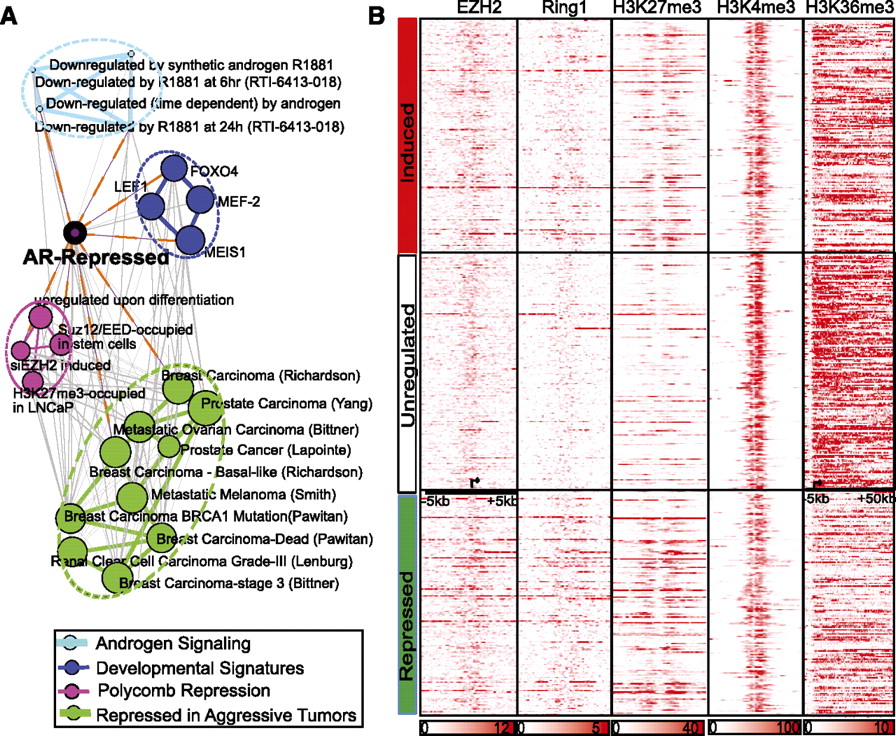
AR-repressed genes are developmental regulators involved in cell differentiation. (A) Network view of the molecular concepts enriched for AR-repressed genes (purple node with black ring). Each node represents a molecular concept or a gene set, with node size proportional to the number of genes within each concept. Each edge represents a statistically significant (P < 1 × 10⁻⁴) (Supplemental Table S3) overlap of genes in the two linked nodes. Enrichments with “androgen signaling” (light blue edges and nodes); enrichments with “developmental signatures” (dark blue); enrichments with “Polycomb repression signatures” (red); and enrichments with “repressed genes in aggressive tumors” (green). (B) ChIP-seq read density of regions surrounding the TSS (−5 to 50 kb for H3K36me3 and ±5 kb for others) of AR-induced or -repressed genes. ChIP-seq data in ES cells were obtained from GSE13084.


