
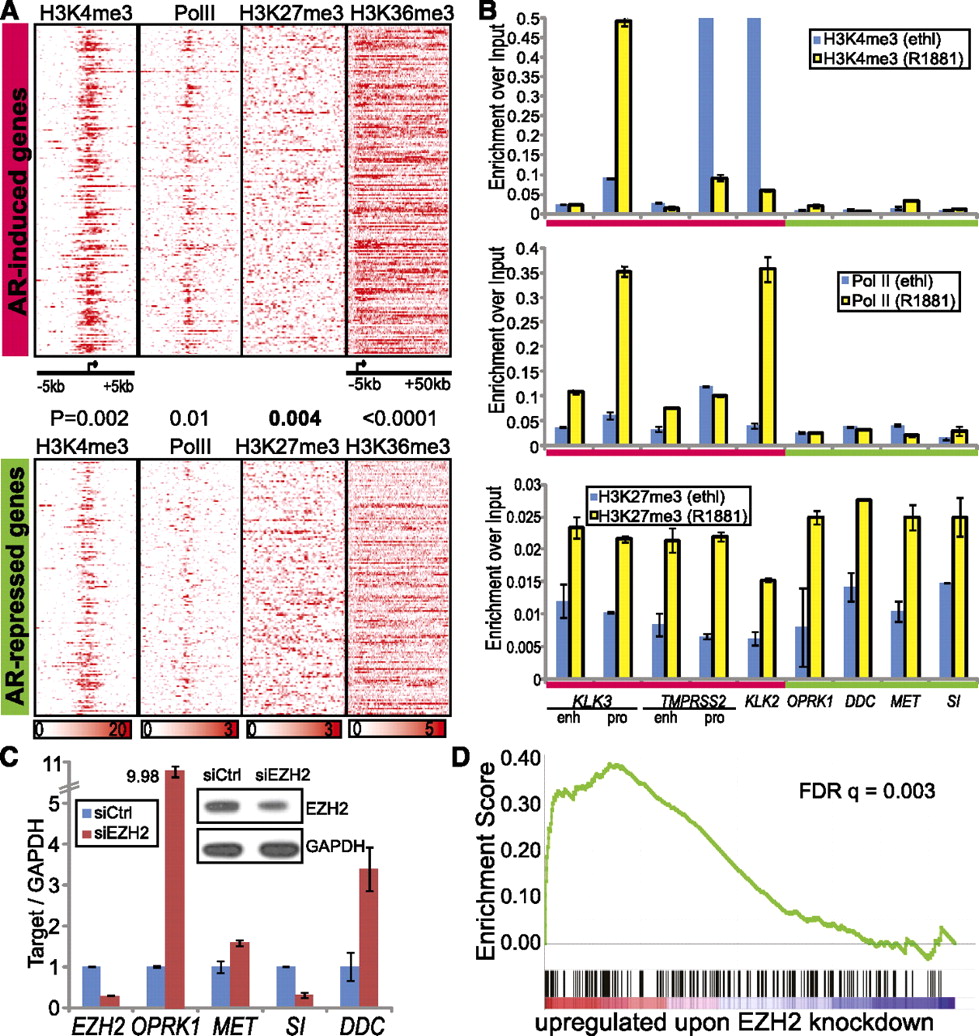
AR-mediated transcriptional repression is dictated by Polycomb group protein EZH2. (A) ChIP-seq binding density of regions surrounding the TSS (±5 kb except −5 to 50 kb for H3k36me3) of AR-induced or -repressed genes. Genes were sorted as in Figure 3A except that those not containing a binding peak are not shown. The P-values indicate significant differences between the binding densities of AR-induced and -repressed genes. (B) Quantitative ChIP-PCR validating AR cofactor binding on AR-regulated genes. ChIP-PCR was performed as described in Figure 3B. Marks with at least marginally significant differences between AR-induced and -repressed genes include Pol II (R1881), H3K27me3 (Ethl), and H3K27me3 (R1881) with P-values equal to 0.05, 0.09, and 0.05, respectively. Error bars: n = 3, mean ± SEM. (C) EZH2 knockdown derepresses AR-repressed genes. LNCaP cells were subjected to RNA interference of EZH2 or a non-targeting control. Differential expression of EZH2 and AR-repressed genes was monitored by qRT-PCR. (Inset) Western blot confirming EZH2 knockdown at the protein level. Error bars: n = 3, mean ± SEM. (D) GSEA showing enrichment of AR-repressed genes in the genes up-regulated by EZH2 knockdown. LNCaP cells were treated with siEZH2 and subjected to expression profiling. The genes differentially regulated by siEZH2 were rank ordered and the enrichment of AR-repressed genes assessed.


