
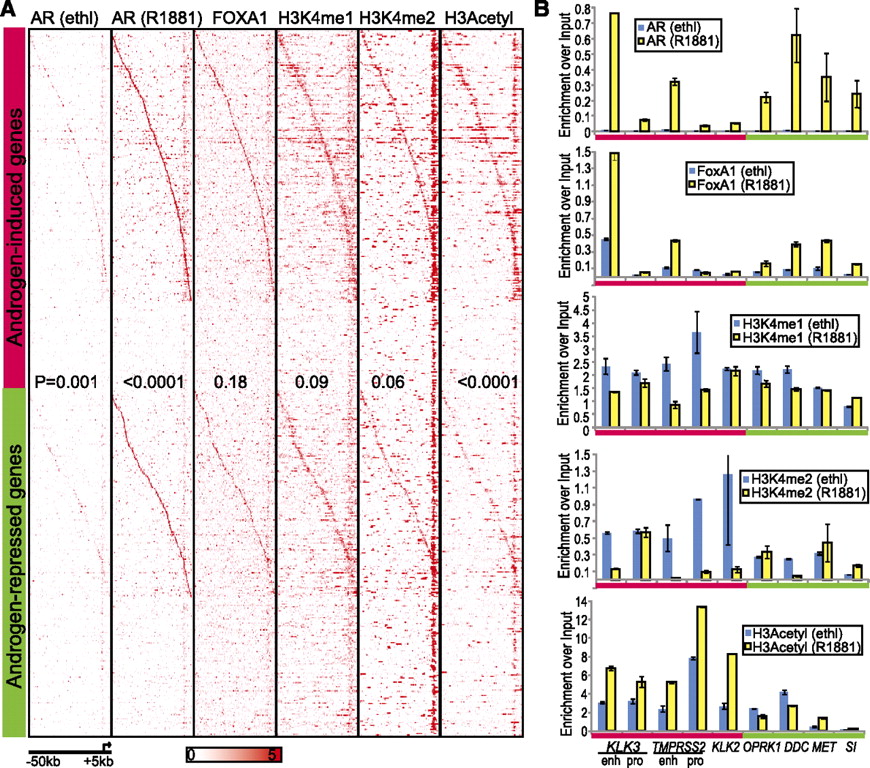
Pioneering factors FOXA1 and H3K4 mono- and di-methylation colocalize with AR at target loci. (A) ChIP-seq binding density of regions surrounding the TSS (−50 kb to +5 kb) of AR-induced or -repressed genes. AR ChIP-seq was performed in hormone-starved LNCaP cells treated with ethanol (Ethl) and androgen (R1881). All other ChIP-seq was performed in LNCaP cells grown in regular medium. AR-induced and -repressed genes were each sorted by the distance of the highest AR (R1881) binding peak to the TSS of its corresponding genes; the genes with the highest AR binding peak most upstream of its TSS were ranked on top. Genes that do not contain a peak within −50 to 5 kb of its TSS were ranked at the bottom of each. The P-values indicate differences between the read densities of the two groups of genes. (B) QRT-PCR validation of reduced AR coactivating factor binding on the AR-regulated genes. ChIP of AR, FOXA1, H3K4me2, H3K4me2, and Acetyl H3 were performed in hormone-starved LNCaP cells treated with ethanol (Ethl) or androgen (R1881) for 16 h. PCR quantification was carried out using primers flanking the promoters of KLK3 and TMPRSS2 (negative control for AR and FOXA1 binding) and the enhancers of all genes. Marks with significant differences between AR-induced and -repressed genes include H3K4me1 (ethl), H3K4me2 (ethl), and H3 acetyl (R1881) with P-values equal to 0.04, 0.01, and 0.009, respectively. Error bars: n = 3, mean ± SEM.


