
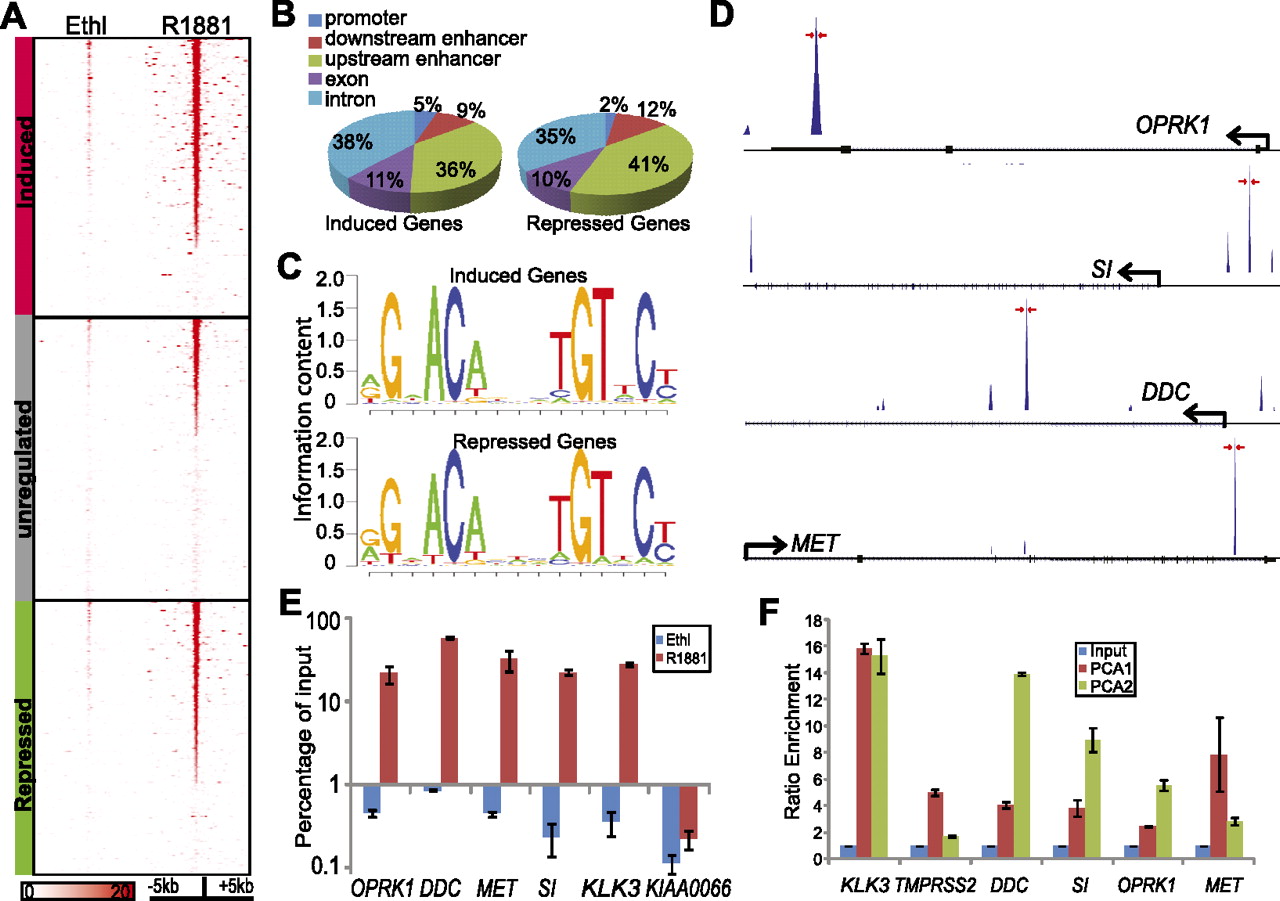
AR directly binds regulatory elements of androgen-repressed genes. (A) AR binding density of regions surrounding the highest peak (±5 kb) of genes induced, unregulated, or inhibited by androgen. AR ChIP-seq was performed in LNCaP cells treated with ethanol (Ethl) or synthetic androgen R1881 for 16 h. Each row represents one gene, and each column represents the binding intensity in each 100-bp window of the corresponding ChIP-seq experiment. Genes were sorted by the height of their highest AR binding peak in R1881 condition. AR ChIP-seq in Ethl condition was ranked according to R1881 condition. (B) Distribution of AR binding sites relative to AR-induced or AR-repressed genes. AR binding sites within the regulatory regions of AR-induced or -repressed genes were further categorized into promoter (within 5 kb upstream of the TSS site), enhancer, exon, and intron regions. (C) The most conserved DNA sequence motifs found in the AR binding sites of AR-induced and -repressed genes. De novo motif search was performed using MDscan of the top 500 AR binding sites associated with either AR-induced or -repressed genes. (D) ChIP-seq AR binding peaks on the regulatory elements of candidate AR-repressed genes. Genomic PCR primers (indicated by red arrows) were designed to flank the binding peaks. (E) AR directly binds to the regulatory elements of candidate AR-repressed genes in LNCaP cells. AR ChIP was done in LNCaP cells treated with Ethl or R1881 for 16 h. ChIP-PCR was performed using primers specific to each candidate gene (red arrows in D), KLK3, and a negative control, KIAA0066. Error bars: n = 3, mean ± SEM. (F) ChIP-PCR demonstrated AR binding to repressed genes in prostate cancer tissue. AR ChIP was performed in two human prostate cancer tissues. The input and ChIP DNA were first amplified by ligation-mediated PCR, and then an equal amount (50 ng) of the amplicons was used for PCR analysis of target genes. Enrichment in the ChIP DNA was measured relative to the input DNA. Error bars: n = 3, mean ± SEM.


