
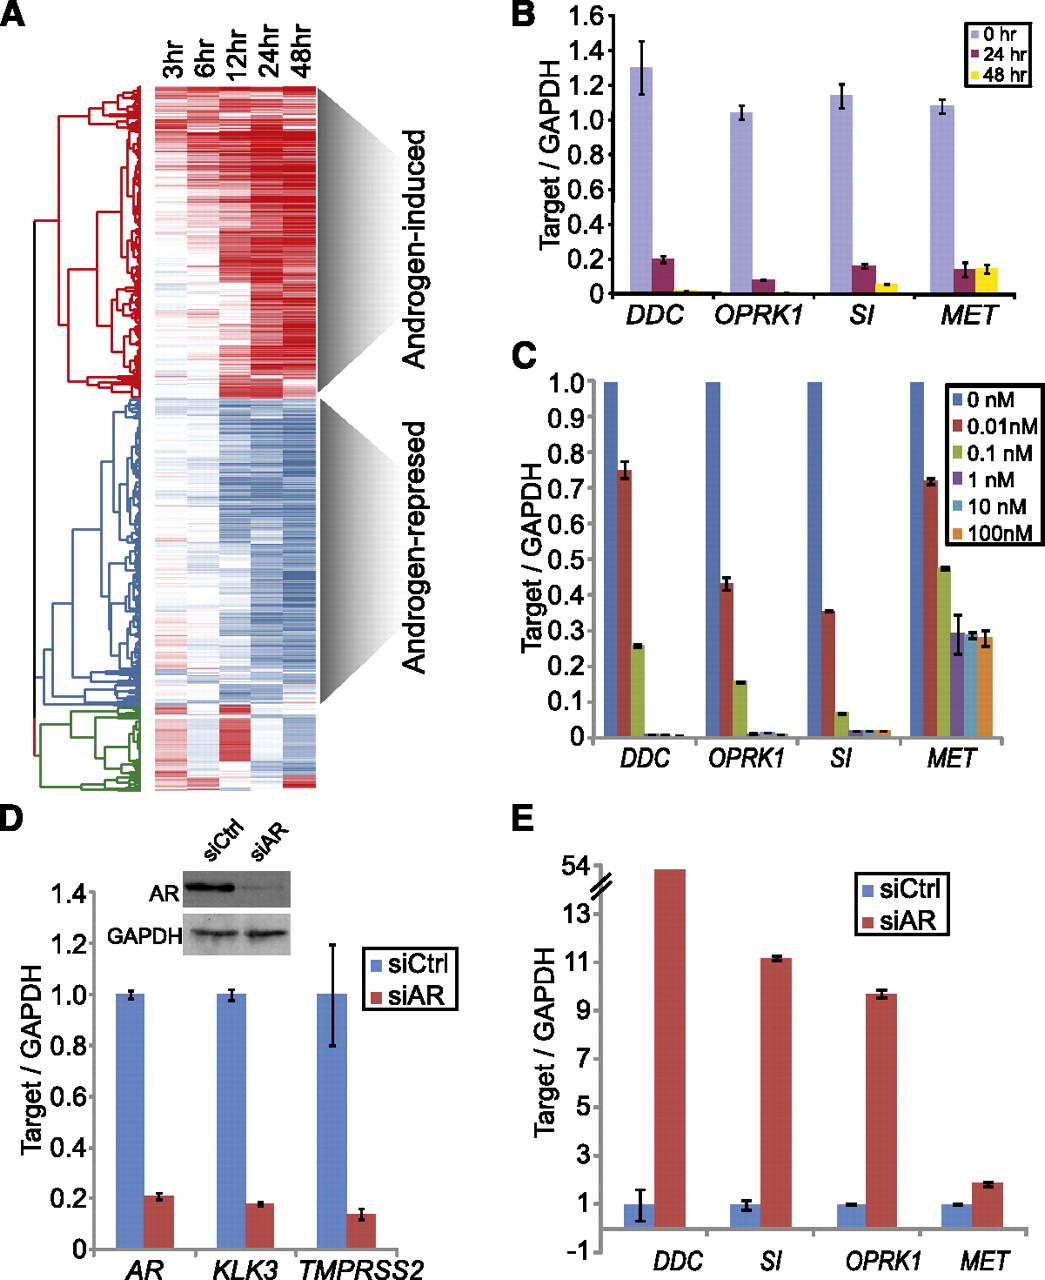
Androgen signaling represses a large set of target genes. (A) Heatmap view of three clusters of genes in responding to time-course androgen treatment. LNCaP cells were hormone-starved for 3 d and treated with 1 nM R1881 for 0, 3, 6, 12, 24, and 48 h. Gene expression was normalized to 0 h. Each row corresponds to one gene, and each column corresponds to a single expression microarray. Candidate genes selected for further validation are marked. (B) QRT-PCR analysis confirmed repression of five candidate genes over a time course. (C) QRT-PCR analysis revealed dose-dependence repression of five candidate genes. (D) AR knockdown suppresses androgen-induced KLK3 and TMPRSS2 genes. LNCaP cells were treated with siRNAs targeting AR or control. The level of AR knockdown was confirmed by both qRT-PCR and immunoblot (inset). The expressional changes of representative AR-induced genes were assayed by qRT-PCR. (E) AR knockdown derepresses androgen-repressed genes. The expression level of candidate genes in LNCaP cells treated with siRNAs targeting AR or control were measured by qRT-PCR. Error bars: n = 3, mean ± SEM. P < 0.01 relative to control treatment for all experiments.


