
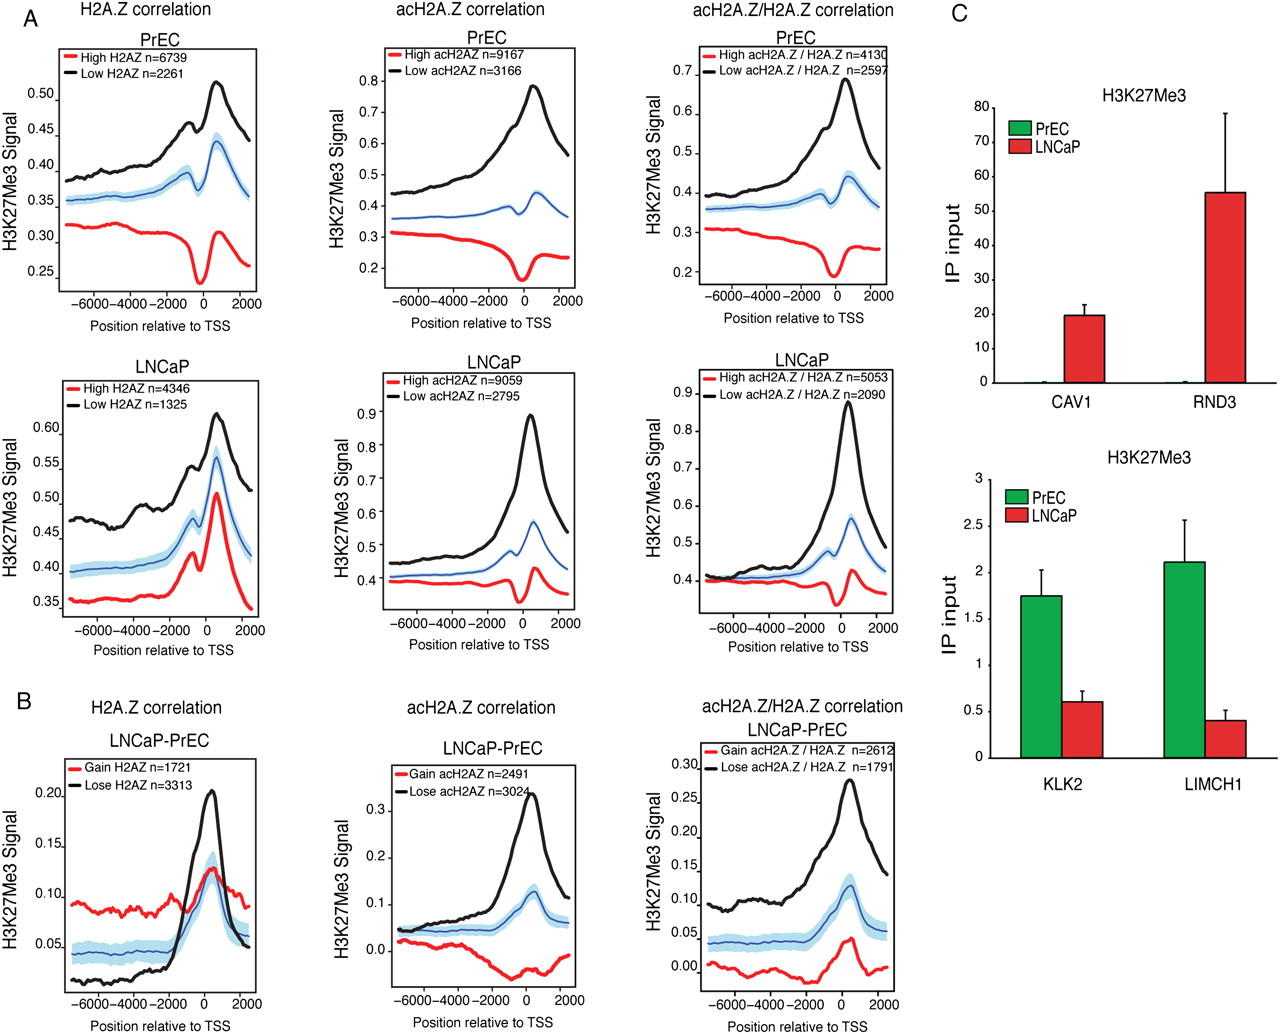
Anticorrelation between H3K27me3 and H2A.Z or acH2A.Z promoter presence in prostate cancer. (A) Significance plots of H3K27me3 signal comparing H2A.Z, acH2A.Z, and acH2A.Z/H2A.Z along gene promoters in genes sorted by high (red line) or low (black line) levels of H2A.Z, acH2A.Z, and acH2A.Z/H2A.Z in PrEC (top) and LNCaP (bottom). The selection criteria of H2A.Z, acH2A.Z, and acH2A.Z/H2A.Z for high levels were t-stats ≥ 1.5 (red line), and t-stats ≤ −1.5 for low levels (black line), as explained in the Supplemental Methods. (B) Significance plots of changes in the H3K27me3 signal (LNCaP-PrEC) along gene promoters in genes sorted by gain (t-stats ≥ 1.5, red line) or loss (t-stats ≤ −1.5, black line) of H2A.Z, acH2A.Z, and acH2A.Z/H2A.Z in LNCaP-PrEC. (C) ChIP qPCR using H3K27me3 antibody was performed to validate the anticorrelation in four different prostate cancer–related genes: CAV1 and RND3 (top) and KLK2 and LIMCH1 (bottom). See Figure 4 for validation of H2A.Z, acH2A.Z levels.


