
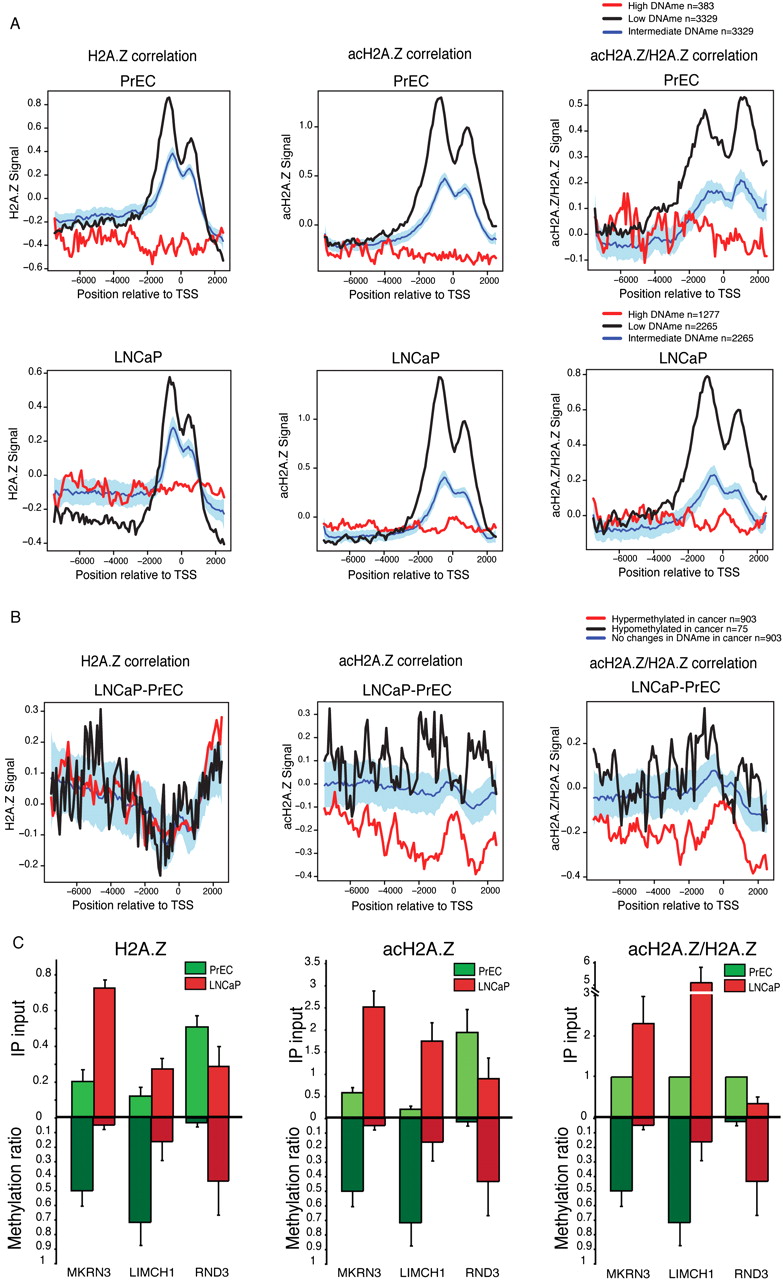
Anticorrelation between DNA methylation and H2A.Z or acH2A.Z in human prostate cancer. (A) Significance plots compared H2A.Z, acH2A.Z, and acH2A.Z/H2AZ with DNA methylation status in PrEC (top) and LNCaP cells (bottom). The average signal of corresponding ChIP-on-chip data (y-axis: signal intensity) of highly methylated genes (>80% relative to the SssI) is represented as a red line along the gene promoter (x-axis), whereas lowly methylated genes are represented as a black line (<20% relative to the SssI). Blue line represents randomly selected genes from the pool of neither high nor lowly methylated; light-blue background covers the 95% confidence interval of the data. (B) Significance plots for the average signal of H2A.Z, acH2A.Z, and acH2A.Z/H2A.Z along gene promoters that change in expression and DNA methylation in LNCaP compared with PrEC (LNCaP-PrEC). Red line corresponds to DNA hypermethylated (≥2-fold) and down-regulated (≥1.5 t-stats) genes; black line represents DNA hypomethylated (≤−2-fold) and down-regulated genes (≤−1.5 t-stats) in LNCaP-PrEC. (C) Three gene examples (RND3, MKRN3, and LIMCH1) that show change in acH2A.Z/H2A.Z promoter enrichment and DNA methylation in prostate cancer. ChIP qPCR of H2A.Z and acH2A.Z confirms a gain of acH2A.Z/H2A.Z. DNA methylation using Sequenom MALDI-TOF analysis of genomic DNA from the promoter region was calculated by averaging the ratios obtained from each CpG site from both LNCaP and PrEC. CpG sites correspond to the same regions analyzed for H2A.Z and acH2A.Z occupancy.


