
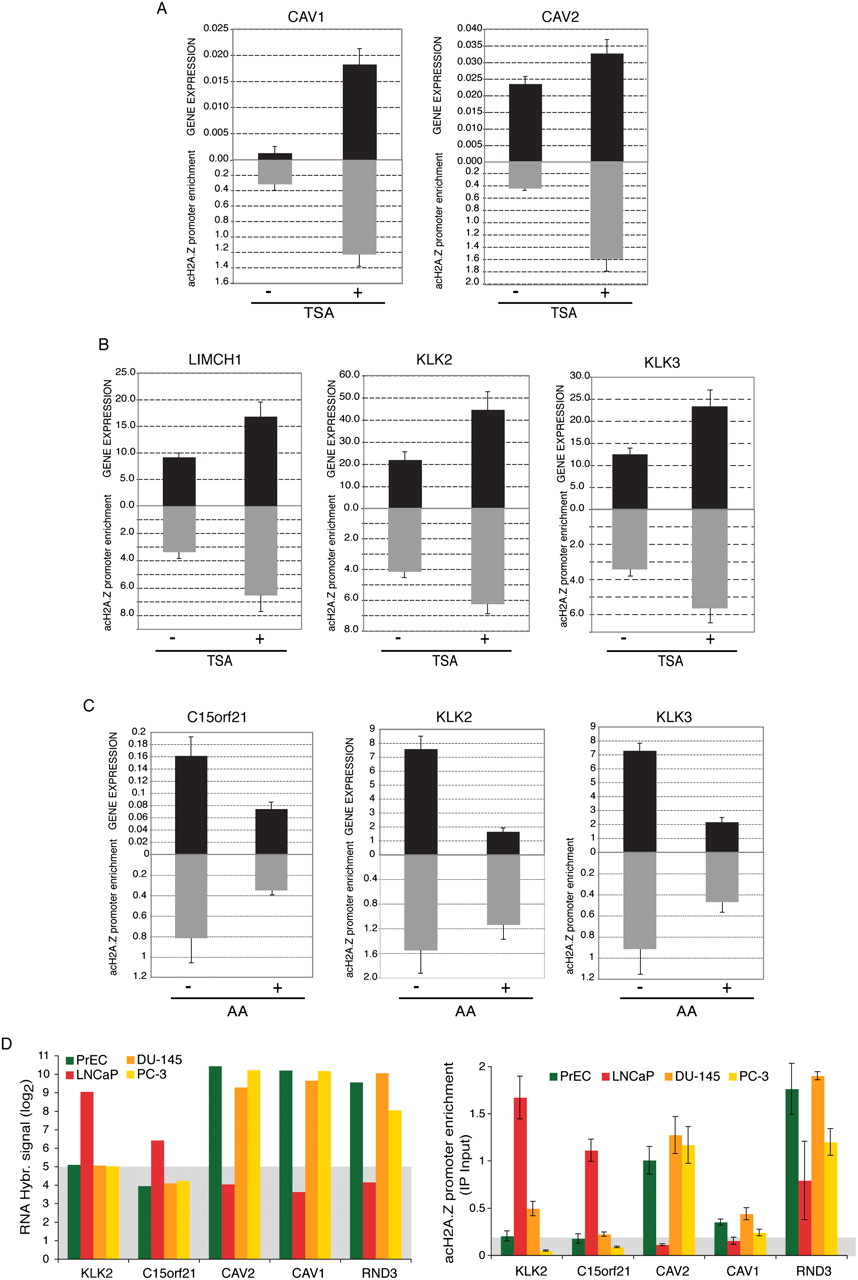
Acetylation of H2A.Z correlates with gene activation in prostate cancer. (A) LNCaP cells were either untreated (−) or treated (+) with Trichostatin A (TSA) at 100 nM for 48 h. Gene expression levels of CAV1 and CAV2 (A) or LIMCH1, KLK2, and KLK3 (B) genes were measured by RT–qPCR, and acH2A.Z levels at TSSs were measured by ChIP qPCR. Relative mRNA levels were normalized using ALAS1. A concordant increase in acH2A.Z and gene activation, after TSA treatment was observed for all genes. (C) LNCaP cells were either untreated (−) or treated (+) with Anacardic Acid (AA) at 90 μM for 48 h. Gene expression levels of C15orf21, KLK2, and KLK3 genes were measured by RT–qPCR, and acH2A.Z levels at the TSS were measured by ChIP qPCR. Relative mRNA levels were normalized using ALAS1. A concordant decrease in acH2A.Z and gene repression, after AA treatment, was observed. (D) (Left) Microarray hybridization signals for mRNA expression levels in PrEC (green), LNCaP (red), DU-145 (orange), and PC-3 (yellow) of five gene examples KLK2, C15orf21, CAV2, CAV1, and RND3. (Right) acH2A.Z ChIP qPCR at the promoter region of KLK2, C15orf21, CAV2, CAV1, and RND3 as per Figure 4. Gray background in the bottom panel highlights an arbitrary threshold for the minimum acH2A.Z signal associated with gene activation. Acetylation of H2A.Z correlates with gene activation in all gene examples.


