
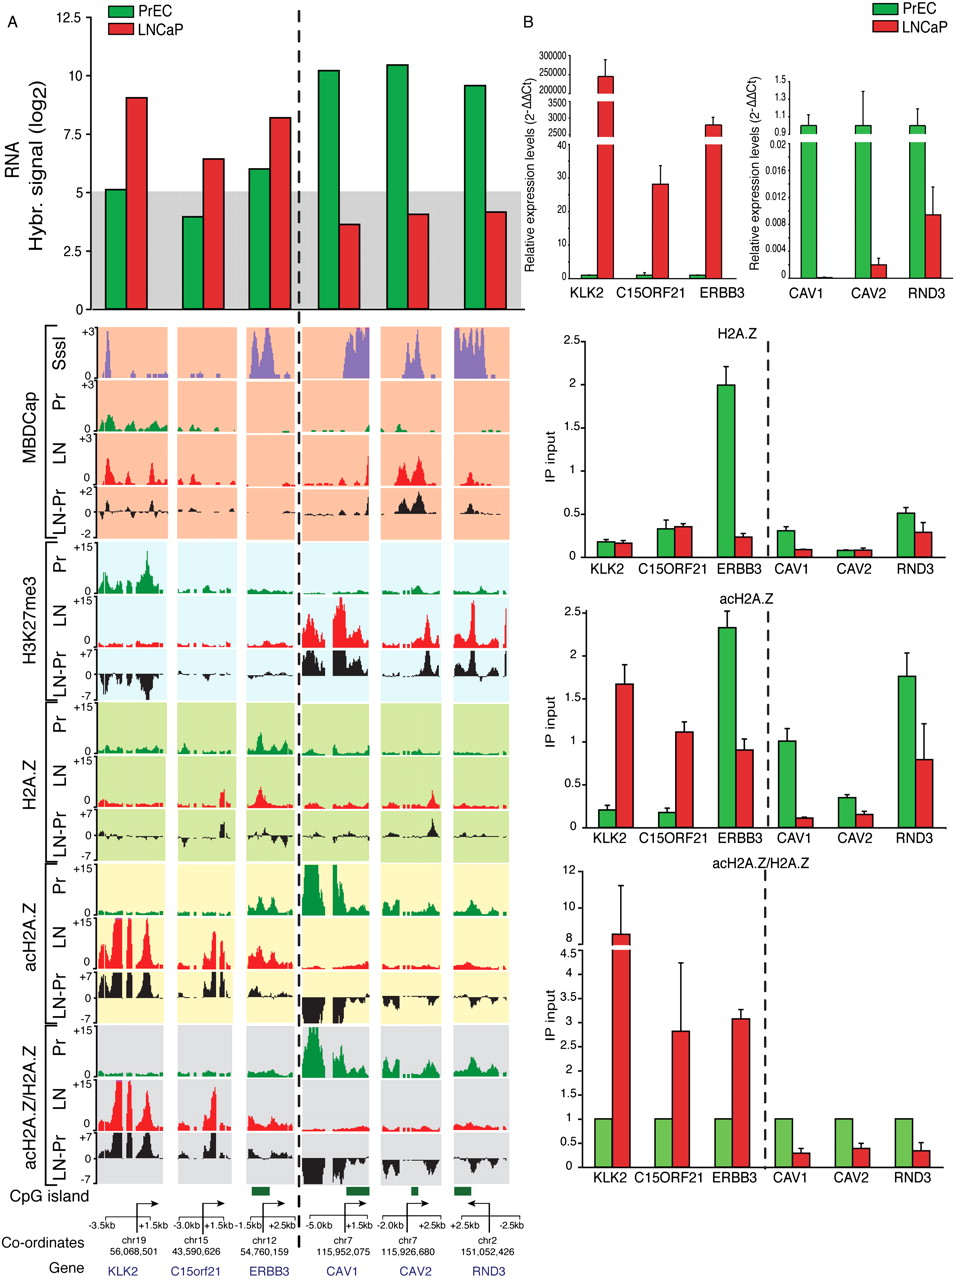
Prostate cancer–related gene deregulation shows opposite acH2A.Z/H2A.Z promoter enrichment profiles. (A) Microarray hybridization signals for mRNA expression levels in LNCaP (red) and PrEC (green) of three example oncogenes: KLK2; C15orf21; and ERBB3; and three example TSGs: CAV1, CAV2, and RND3 (top). (Bottom) UCSC Genome Browser tracks for DNA methylation (MBDCap.seq, red background), H3K27me3 (blue background), H2A.Z, acH2A.Z and acH2A.Z/H2A.Z ChIP-on-chip profiles. SssI (violet tracks): fully methylated positive control DNA. (B) Validation of tiling array, gene expression, and ChIP-on-chip data for H2A.Z, acH2A.Z, and acH2A.Z/H2A.Z using real-time qPCR. Relative mRNA levels normalized using GAPDH. For ChIP data, all samples were normalized with their corresponding Input chromatin and represented as 2-ΔCT (see Methods). H2A.Z and acHA.Z data are representative examples of three independent experiments; acH2A.Z/H2A.Z is represented as fold change of LNCaP relative to PrEC (mean of the fold change ±SEM). Note, for the ERBB3 gene, there is a gain of the relative acetylation of H2A.Z (acH2A.Z/H2A.Z fold enrichment) in LNCaP cells due to the relative depletion of total H2A.Z in this region (H2A.Z IP). Abbreviations, colors, and symbols are the same as in Figure 3.


