
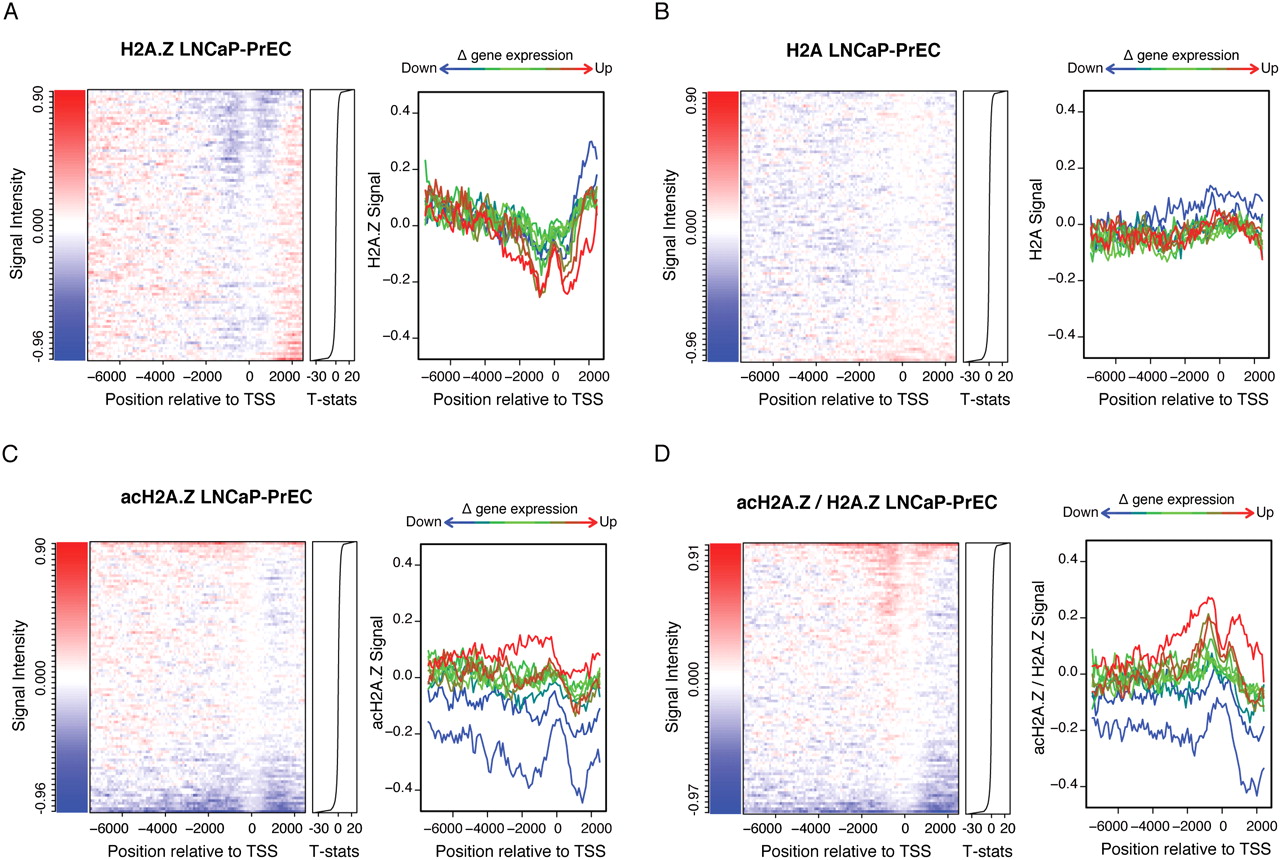
H2A.Z, H2A, and acH2A.Z occupancy changes with gene deregulation in prostate cancer. Heatmaps (left) and line plots (right) for H2A.Z (A), H2A (B), acH2A.Z (C), and acH2A.Z/H2A.Z (D) were made according to changes in gene expression in LNCaP relative to PrEC (LNCaP-PrEC), represented as a moderated t-statistics (T-stats), to study nucleosome occupancy with changes in gene expression. For heatmaps, genes were sorted into groups of 500 genes, according to changes in gene expression in LNCaP-PrEC, from down-regulated (bottom) to up-regulated (top). The color scale represents changes in signal intensity of each antibody (using a two-sided t-test), between LNCaP and PrEC from blue (loss of signal) to red (gain of signal). For line plots, groups of 2500 genes were generated according to changes in gene expression in LNCaP-PrEC. The y-axis represents the average change in each antibody between LNCaP and PrEC. Line colors are as described for Figure 1.


