
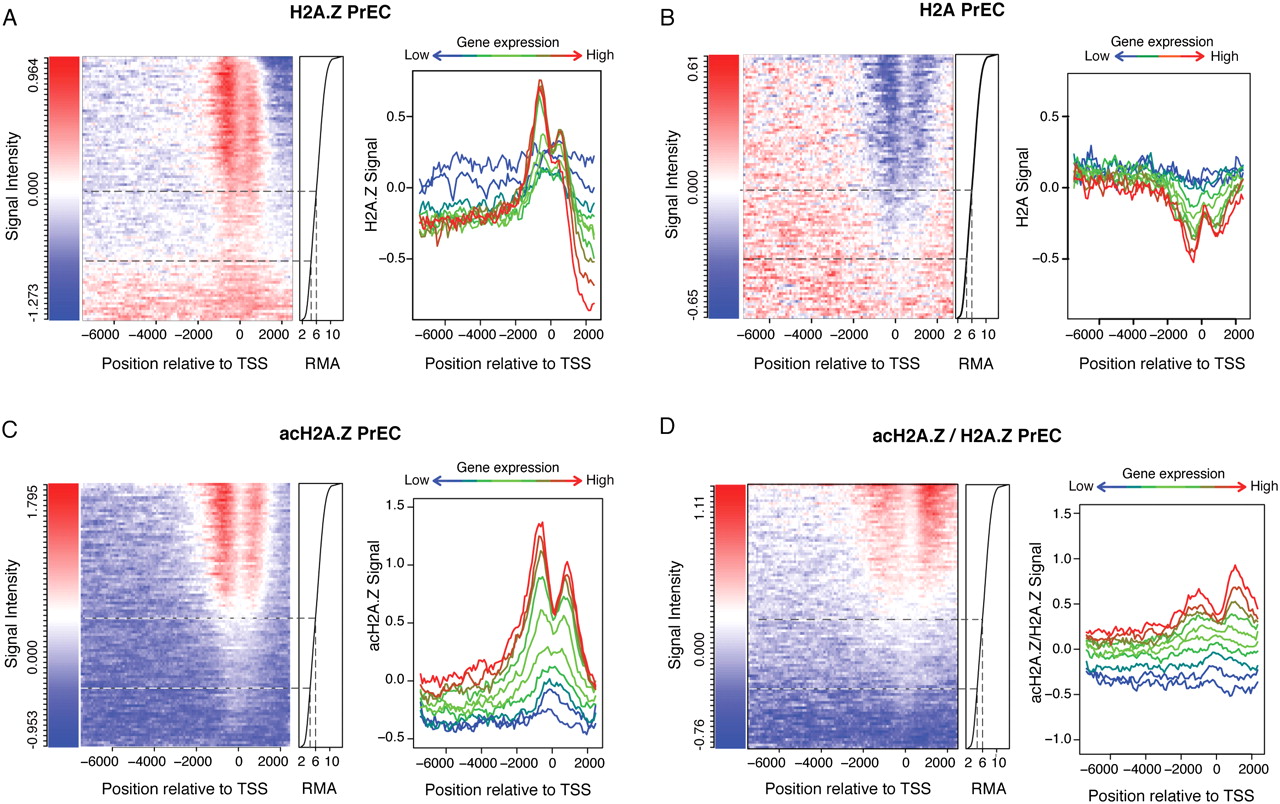
Correlation between gene expression and H2A.Z, H2A, acH2A.Z promoter occupancy in PrEC cells. Heatmaps (left) showing levels of H2A.Z (A), H2A (B), acH2A.Z (C), and acH2A.Z/H2A.Z (D) across gene promoters according to gene expression in PrEC. The x-axis represents promoter coordinates (−7500 bp to +2450 bp), where 0 is the transcriptional start site (TSS). Each row of the y-axis represents the average H2A.Z (A), H2A (B), acH2A.Z (C), and acH2A.Z/H2A.Z (D) signal intensity of 500 genes ordered according to gene expression levels (right), using robust multichip analysis (RMA). Antibody signal intensity (using MAT normalization) is represented from blue (low signal) to red (high signal). AcH2A.Z/H2A.Z represents acH2A.Z normalized with H2A.Z total levels. Black dotted lines demark genes either inactive (RMA < 4.5, 25% of the genes), or transcribed, either at basal levels (RMA 4.5–6, 25%) or medium or high levels (RMA > 6, 50%). Line plots (right) for H2A.Z (A), H2A (B), acH2A.Z (C), and acH2A.Z/H2A.Z (D) show enrichment in PrEC according to different levels of expression. Gene expression levels were split in groups of 2500 genes (blue for low expressed genes; green to red for high expressed genes). The average signal of the specific group was plotted along the gene promoter.


