
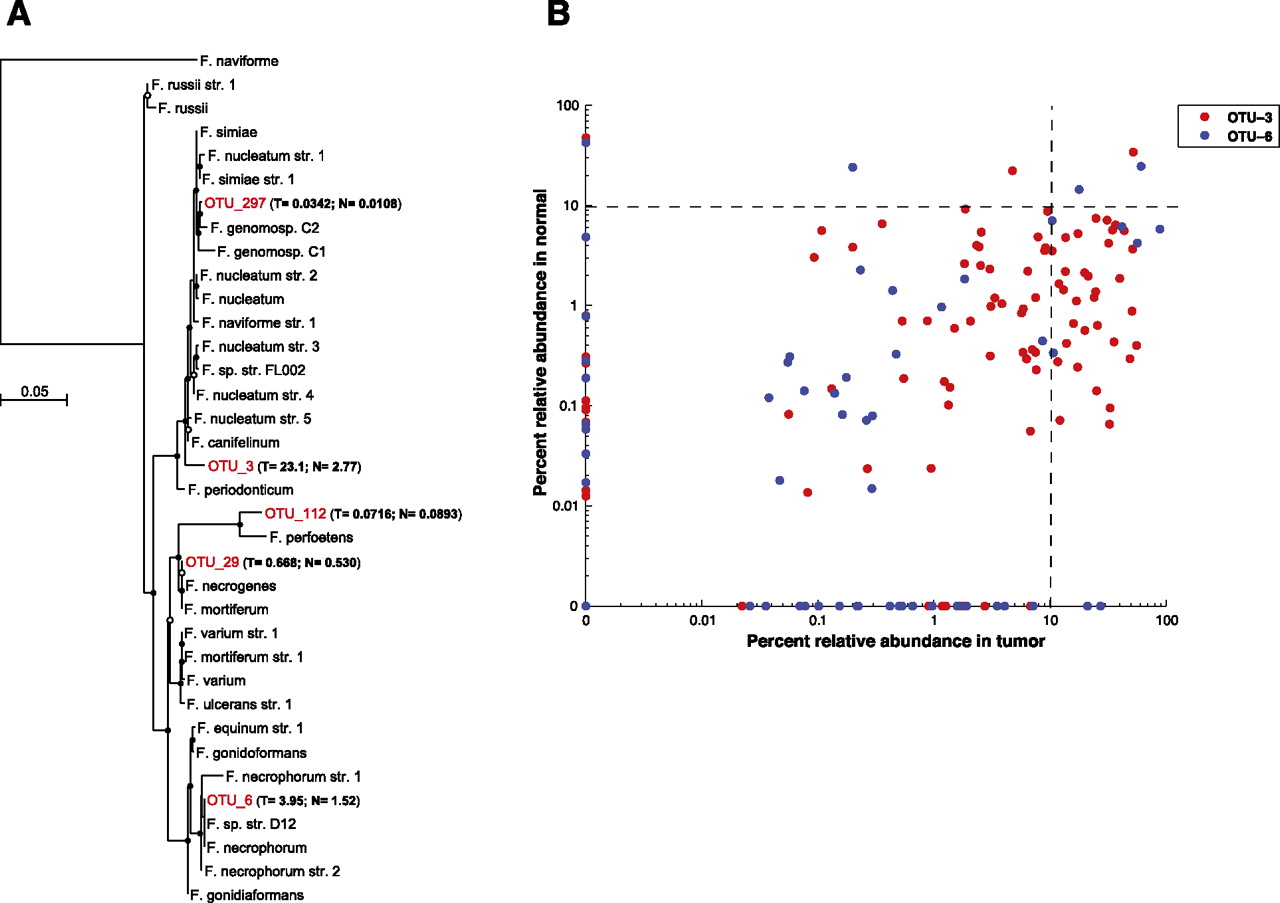
Phylogenetic analysis identifies several Fusobacterium species in human colon cancer tissues. (A) Approximately-maximum-likelihood phylogenetic trees were constructed on the V3–V5 region of the 16S rDNA gene using 31 reference Fusobacterium species along with the five most prominent OTUs identified in colon cancer specimens (indicated in red). Nodes that have bootstrap support above 50% and 75% are indicated with a white and black dot, respectively. The mean percent relative abundance in tumor (T) and normal (N) of each OTU is indicated in parentheses. The full names of the reference strains appear in Supplemental Table S6. (B) The abundance of the indicated OTU relative to all other phylotypes in a given specimen is shown for the two most abundant Fusobacterium OTUs in tumors (x-axis) and normal colon tissue (y-axis); each point represents tumor and normal abundance data for a different individual. The lower-right quadrant of the graph highlights the substantial proportion of patients for whom the Fusobacterium abundance is >10% in tumors but <10% in the matched normal.


