
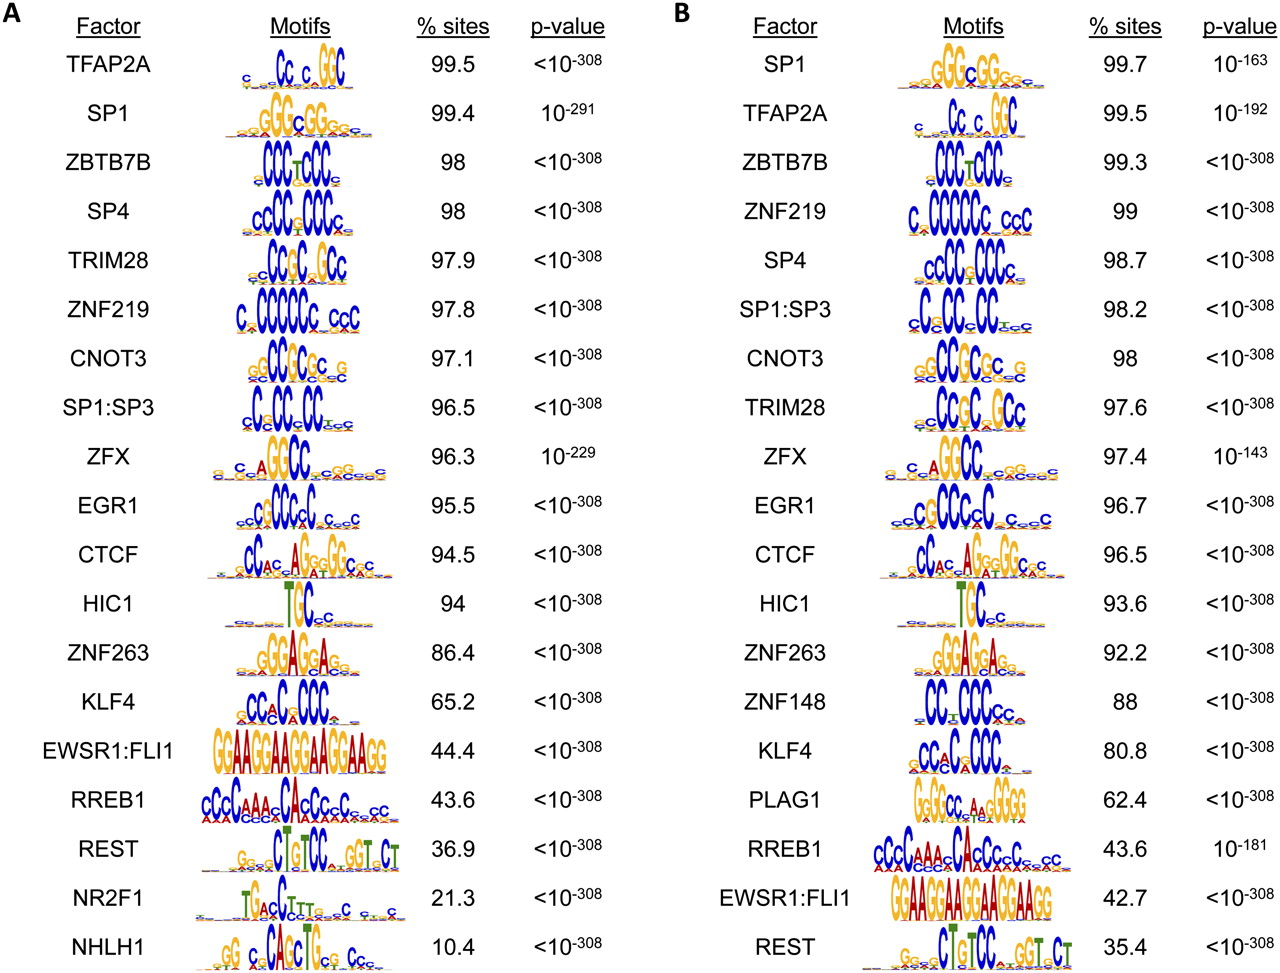
Figure 5.
Motif analysis for differentially methylated sites. Motif analysis for hypermethylated sites shared by all tumors (n = 3780) (A) and CIMP-specific hypermethylated sites (n = 2026) (B). The frequency of observing each motif within each subset of sequences is expressed as a percentage (% sites). The P-value of enrichment testing for individual motif in each data set is indicated.


