
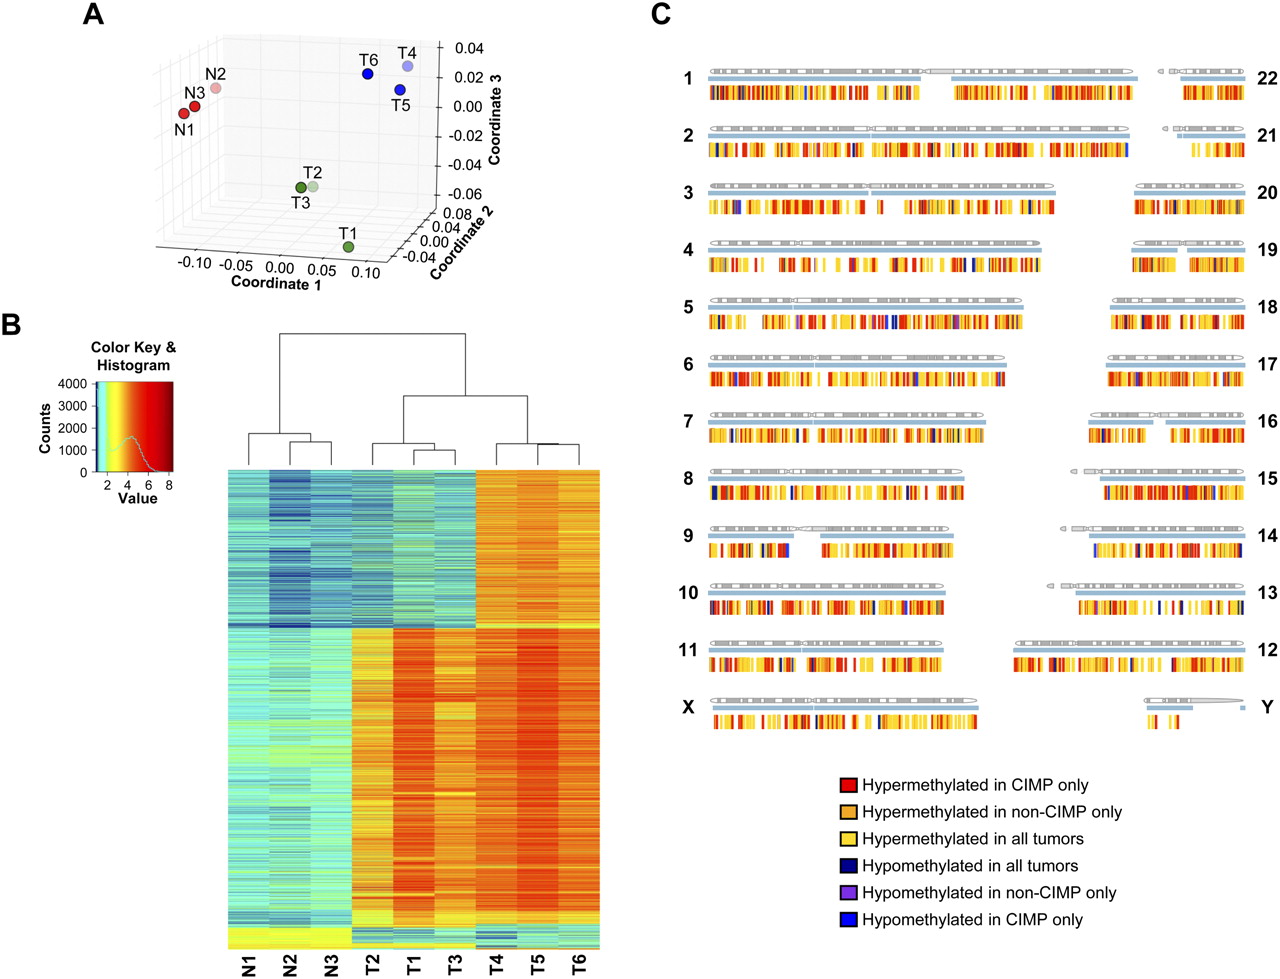
Mapping and comparisons of the DNA methylomes of normal colon, non-CIMP colon cancer, and CIMP colon cancer specimens. (A) Multidimensional scaling plot of the nine samples using their individual genome-wide DNA methylation profiles. (Red dots) Normal colon samples; (green dots) non-CIMP colon cancer samples; (blue dots) CIMP colon cancer samples. (B) Heatmap and unsupervised hierarchical clustering of the nine samples based on their individual DNA methylation status at 6135 sharp yes/no differentially methylated sites. (N1, N2, N3) Normal colon specimens; (T1, T2, T3) non-CIMP cancer specimens; (T4, T5, T6) CIMP cancer specimens. (C) Spatial distribution of sharp yes/no differentially methylated sites in the genome. Each sharp yes/no differentially methylated site is represented by a vertical tick below each chromosome. Each differential methylation pattern is represented by one color according to the color key. The blue horizontal line under each chromosome represents regions of the chromosome where DNA methylation was detected in any of the nine samples.


