
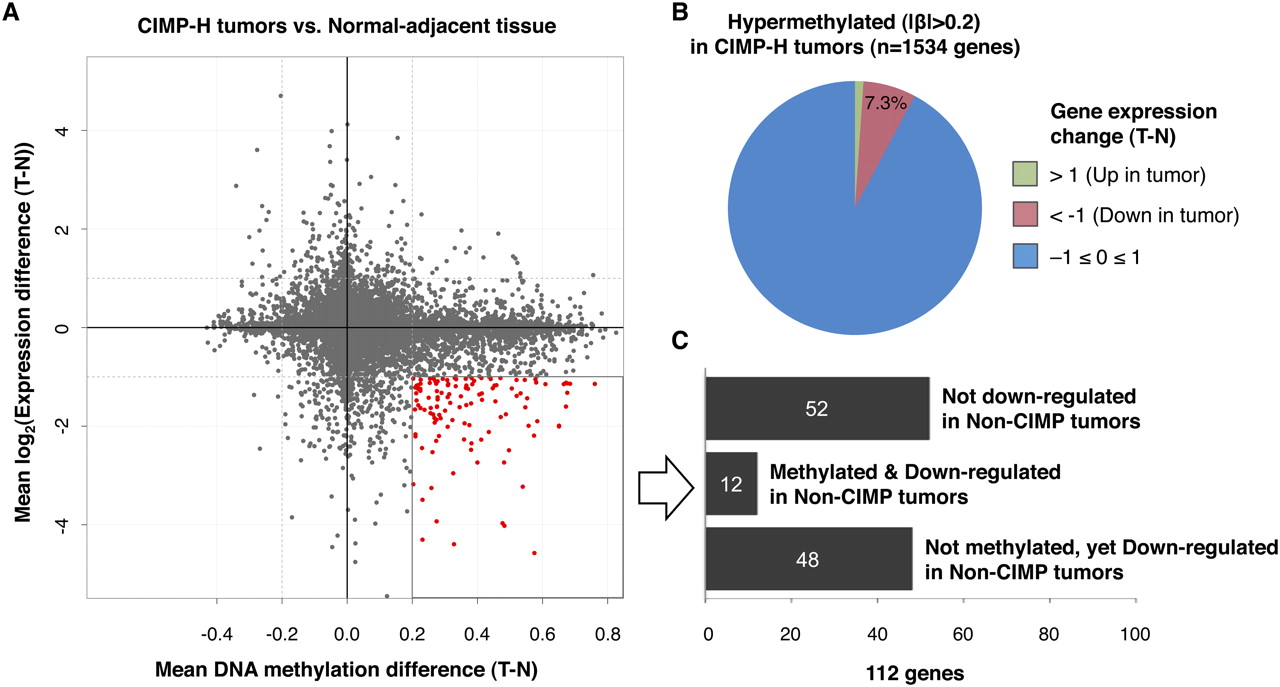
Integrated analysis of gene expression and promoter DNA methylation changes between colorectal tumors and matched normal adjacent tissues. (A) Mean DNA methylation β-value differences between CIMP-H tumors and matched normal colonic tissues (n = 6) are plotted on the x-axis, and mean log2-transformed gene expression value differences are plotted on the y-axis for each gene. Red data points highlight those genes that are hypermethylated with a β-value difference >0.20 and show more than twofold decrease in their gene expression levels in CIMP-H tumors. (B) Pie chart showing the gene expression changes of 1534 hypermethylated genes in CIMP-H tumors compared with adjacent normal tissues. (C) Bar chart showing the number of genes that exhibit DNA hypermethylation and/or gene expression changes in non-CIMP tumors among the 112 genes that are hypermethylated and down-regulated in CIMP-H tumors.


