
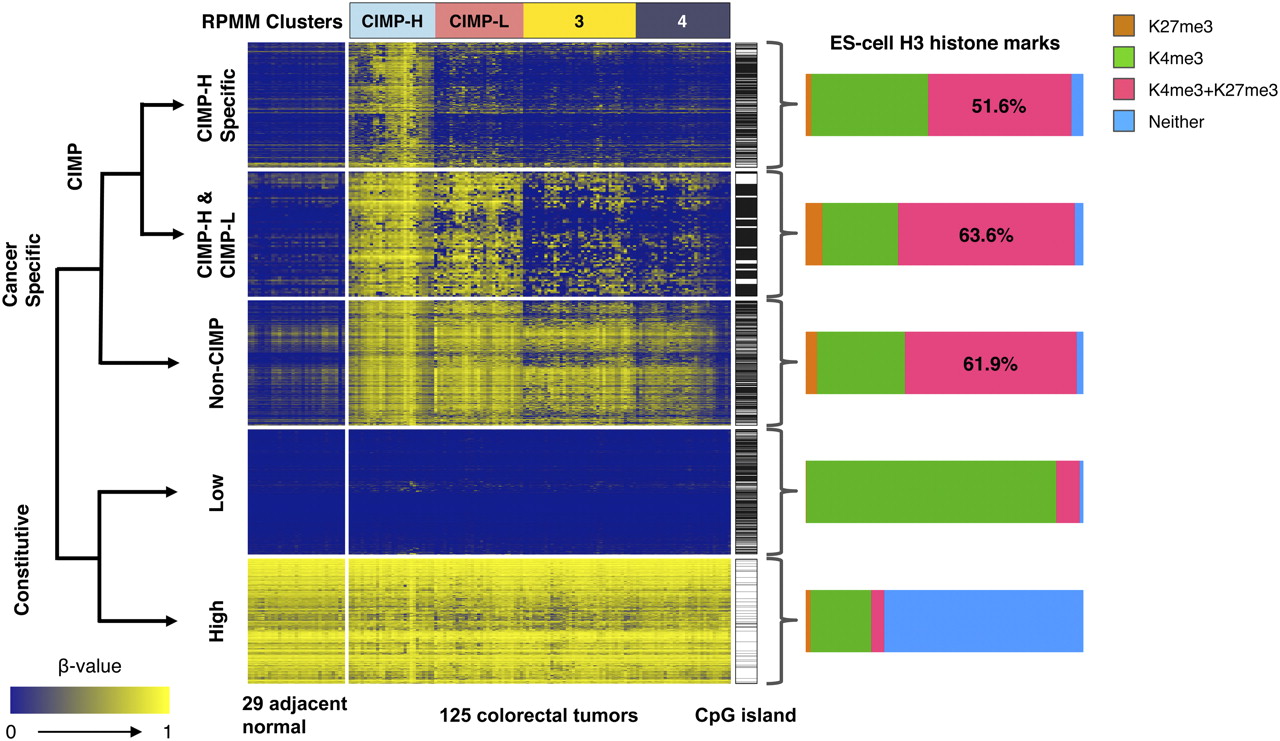
ES-cell histone marks associated with genes in the five classification groups described in the text. Shown are heatmap representations of DNA methylation β-values for unique gene promoters that belong to five different categories: (1) CIMP-H specific: CIMP-associated DNA methylation markers specific for the CIMP-H subgroup only (n = 415 genes); (2) CIMP-H & CIMP-L: CIMP-specific DNA methylation shared between the CIMP-H and CIMP-L subgroups (n = 73 genes); (3) Non-CIMP: Cancer-specific DNA methylation but outside of the CIMP context (n = 547 genes); (4) Constitutive-Low: Constitutively unmethylated genes in both tumor and adjacent normal tissue samples (n = 500 genes); (5) Constitutive-High: Constitutively methylated in both tumor and adjacent normal tissue samples (n = 500 genes). Genes containing CpG islands defined by Takai and Jones (2002) are indicated by horizontal black bars immediately to the right of each heatmap. The bar charts to the right of each heatmap show the proportion of gene promoters with occupancy of histone H3 lysine 4 trimethylation (K4me3) and/or histone H3 lysine 27 trimethylation (K27me3) in human ES cells. Probes that do not have this histone mark information (listed in Supplemental Table 4 as “NA”) were not included in the bar chart calculations. The probes in each category are ordered according to the unsupervised hierarchal clustering using a correlation distance metric and average linkage method. The RPMM-based cluster assignments are indicated above the heatmaps.


