
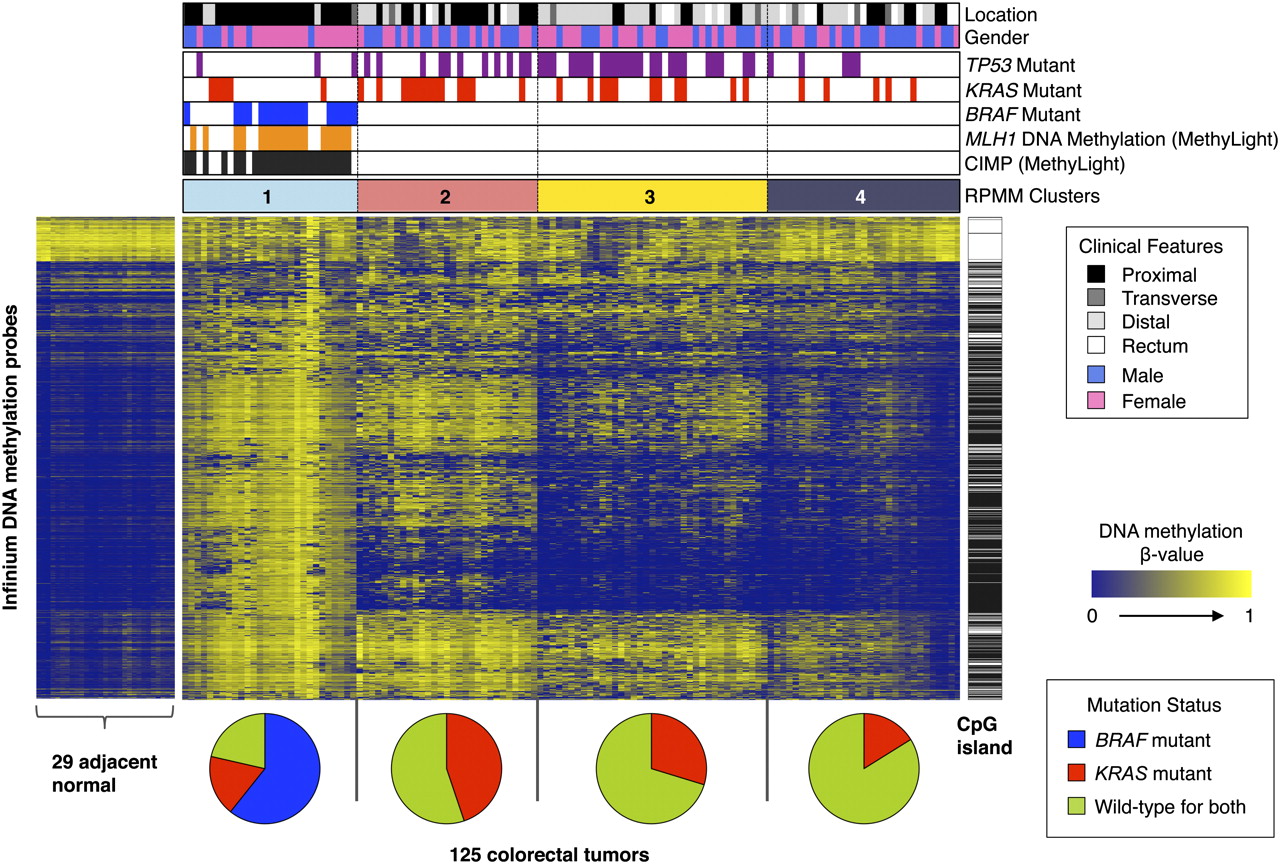
RPMM-based classification of 125 colorectal tumor samples and heatmap representation of Infinium DNA methylation data. DNA methylation profiles of 1401 probes with most variable DNA methylation values (standard deviation >0.20) in the 125 colorectal tumor sample set. The DNA methylation β-values are represented by using a color scale from dark blue (low DNA methylation) to yellow (high DNA methylation). Four subgroups were derived by RPMM-based clustering and are indicated above the heatmap: (light sky blue) cluster 1 (n = 28); (light coral) cluster 2 (n = 29); (yellow) cluster 3 (n = 37); (dark gray) cluster 4 (n = 31). (Black bars) CIMP-positive tumors as classified by the MethyLight five-marker panel (Weisenberger et al. 2006). Presence of MLH1 DNA methylation (orange bars), BRAF mutation (blue bars), KRAS mutation (red bars), and TP53 mutations (purple bars). Probes that are located within CpG islands (Takai-Jones) (Takai and Jones 2002) are indicated by the horizontal black bars to the right of the heatmap. The probes are arranged based on the order of unsupervised hierarchal cluster analysis using a correlation distance metric and average linkage method. Pie charts below the heatmap show the proportion of tumor samples harboring BRAF mutations (blue), KRAS mutations (red), and those that are wild-type for both BRAF and KRAS (yellow-green) within each subgroup.


