
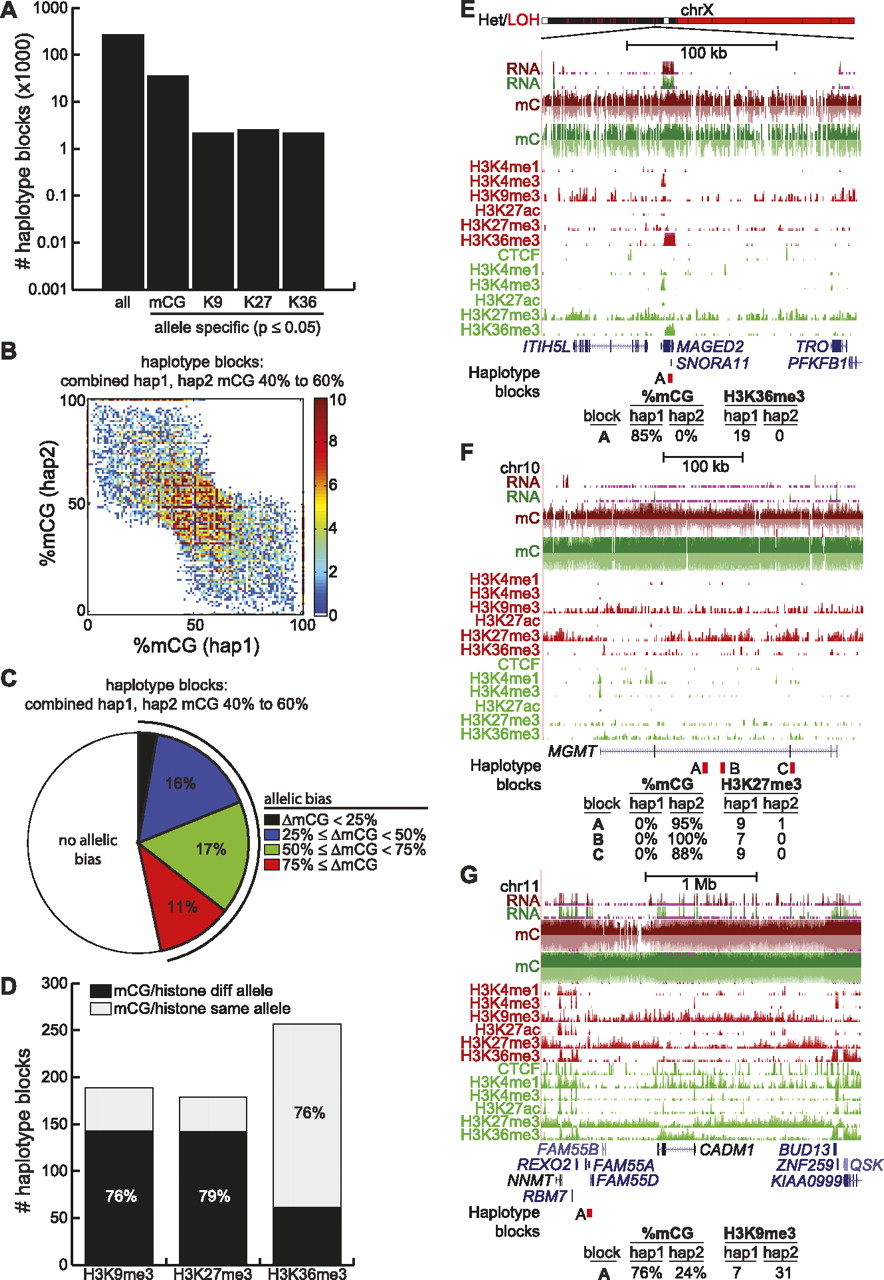
Allelic distribution of epigenetic modifications. (A) Number of haplotype blocks found by SNP phasing (denoted all), and the number of these blocks showing significant allelic bias for mCG, H3K9me3 (denoted K9), H3K27me3 (denoted K27), and H3K36me3 (denoted K36) (Fisher's exact test P-value ≤ 0.05). (B) For haplotype blocks where the combined frequency of methylation of both haplotypes is between 40% and 60%, shown is the density plot of %mCG on haplotype 1 versus %mCG on haplotype 2. (C) For haplotype blocks in B, shown is the fraction with allelic bias (Fisher's exact test P-value ≤ 0.05), for different possible values of allelic bias. ΔmCG = |%mCG(hap1) − %mCG(hap2)|. (D) Of haplotype blocks simultaneously showing allelic bias in mCG (Fisher's exact test P-value ≤ 0.05, ΔmCG ≥ 50%) and a histone modification (Fisher's exact test P-value ≤ 0.05), the number of haplotype blocks where mCG is on the same or different allele as the histone modification. (E) Allelic H3K36me3 at the MAGED2 gene. The bar at top indicates where one arm of chrX was lost. (Red) HCC1954, (green) HMEC. (Bottom) Number of H3K36me3 reads belonging to haplotype 1 or 2. (F) Allelic H3K27me3 at the MGMT tumor suppressor. (Red) HCC1954, (green) HMEC. (Bottom) Number of H3K27me3 reads belonging to haplotype 1 or 2. (G) Allelic H3K9me3 near the CADM1 tumor suppressor. (Red) HCC1954, (green) HMEC. (Bottom) Number of H3K9me3 reads belonging to haplotype 1 or 2.


