
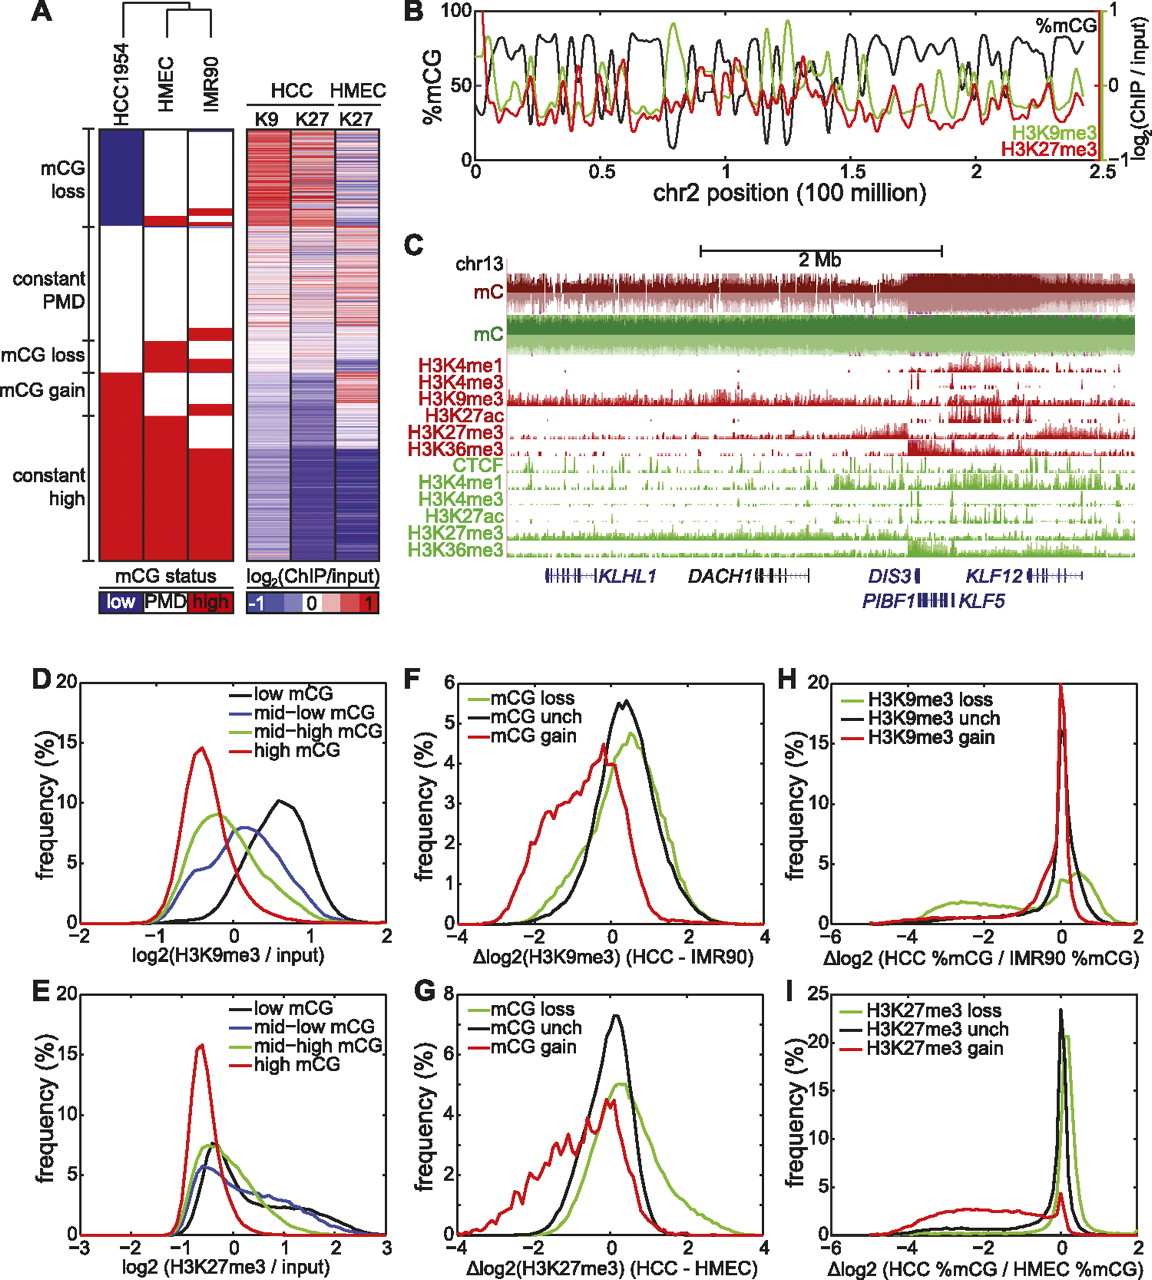
Repressive chromatin is depleted of mCG. (A) (Left) A reproduction of Figure 1D; (right) each of the 282,109 rows represents the H3K9me3 (denoted K9) and H3K27me3 (denoted K27) status in HCC1954 and HMEC, in the same order as the left panel. (B) Distribution of %mCG, H3K9me3, and H3K27me3 on chromosome 2 for HCC1954. (C) A large domain of DNA hypomethylation near the DACH1 tumor suppressor coincides with H3K9me3 and H3K27me3 in HCC1954. (Red) HCC1954, (green) HMEC. (D) Distribution of H3K9me3 enrichment for four quantiles of DNA methylation status in HCC1954. (E) As in D, but for H3K27me3. (F) Distribution of change in H3K9me3 in HCC1954 compared with IMR90 for 10-kb windows that lose mCG, gain mCG, or are unchanged for mCG. Δlog2 (H3K9me3) = log2 (HCC1954 H3K9me3/input) − log2 (IMR90 H3K9me3/input). (G) As in F, but for H3K27me3 comparing HCC1954 with HMEC. (H) Distribution of change in mCG in HCC1954 compared with IMR90 for 10-kb windows that lose H3K9me3, gain H3K9me3, or are unchanged for H3K9me3. (I) As in H, but for H3K27me3 comparing HCC1954 with HMEC.


