
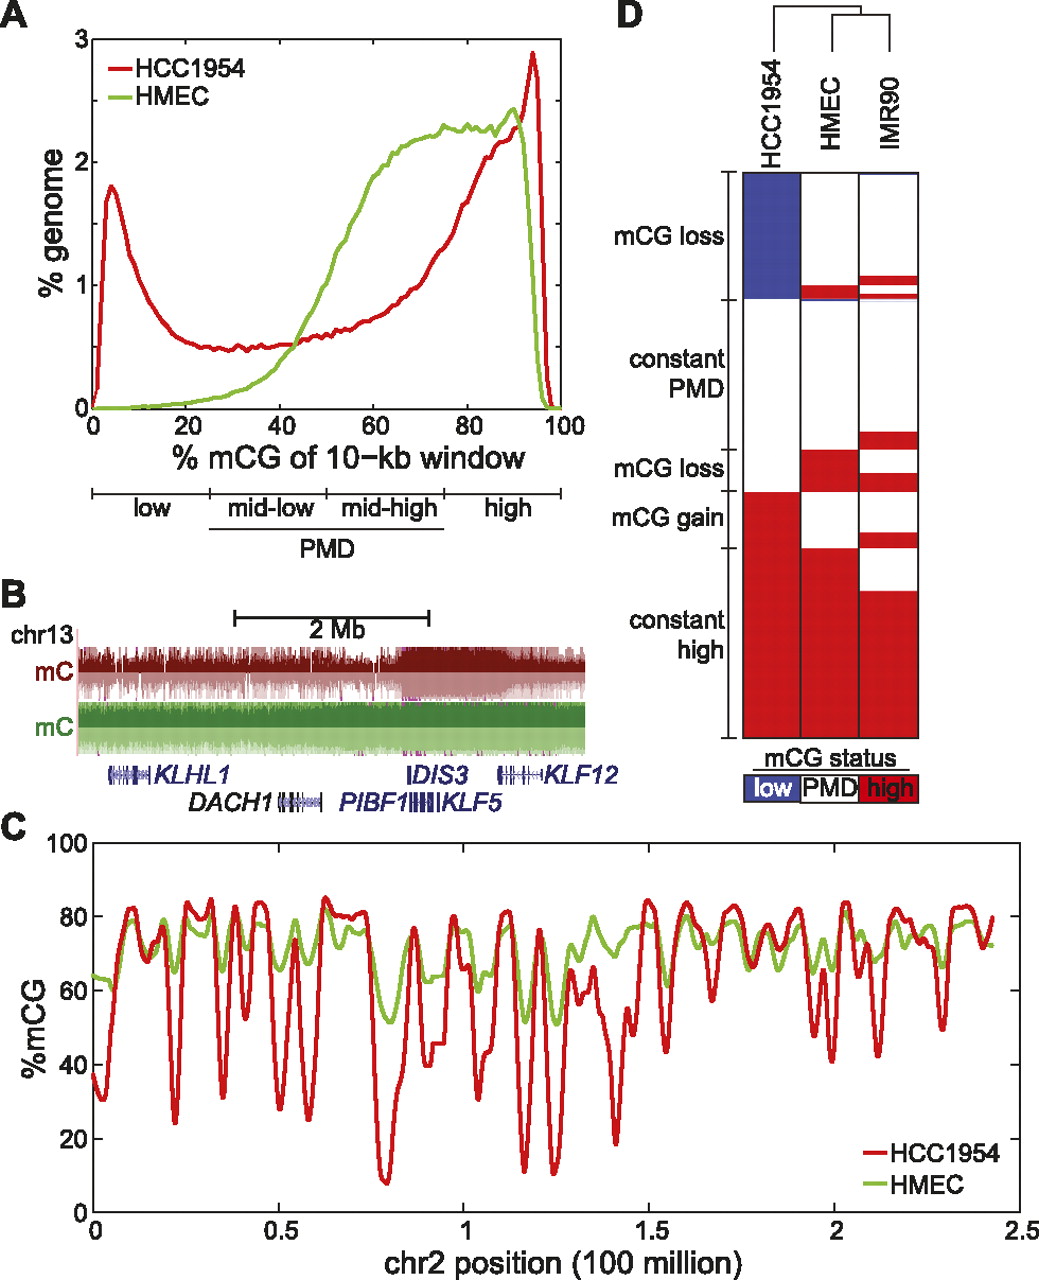
Global hypomethylation in breast cancer. (A) Distribution of %mCG for all 10-kb windows in the human genome. Quartiles of increasing %mCG are labeled as low, mid-low, mid-high, and high %mCG, with mid-low and mid-high representing partially methylated domains (PMDs). (B) A large domain of hypomethylation near the DACH1 tumor suppressor. (Red) HCC1954, (green) HMEC. (C) Distribution of %mCG on chromosome 2 for the breast cancer cell line HCC1954 and the normal breast line HMEC. (D) A heatmap of low, PMD, and high %mCG for all 10-kb windows in the human genome. Each of the 282,109 rows represents the mCG status for a 10-kb window in HCC1954, HMEC, and IMR90 fibroblast cells. The dendrogram represents the similarity (Pearson correlation) of the profiles across different cells.


