
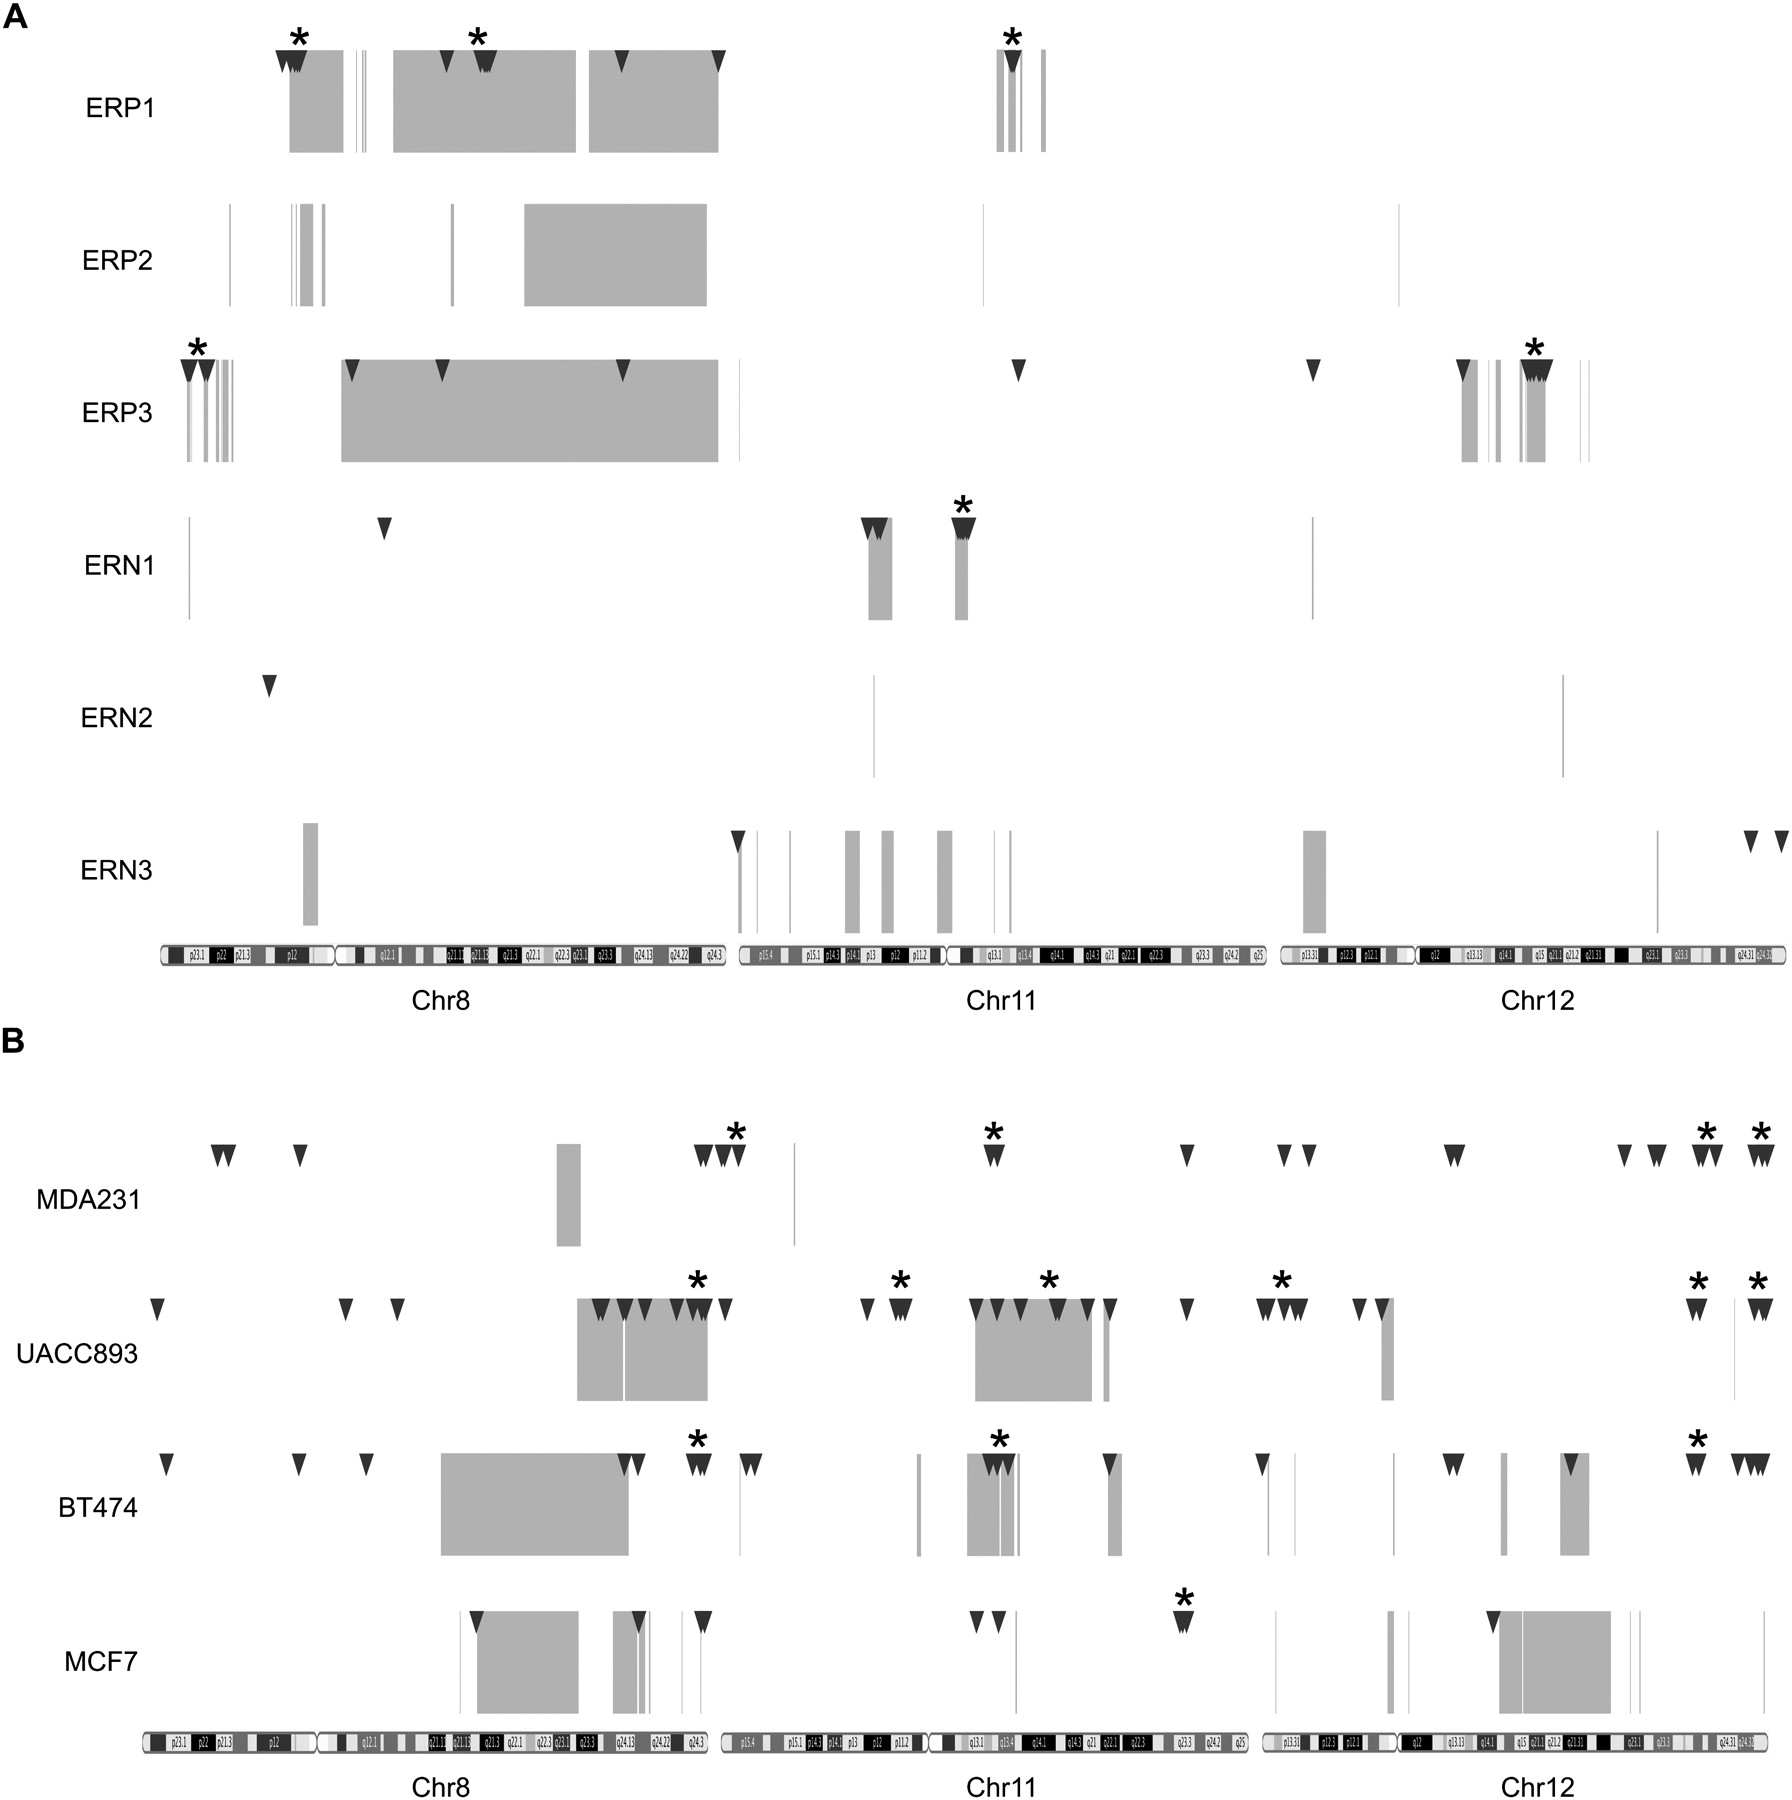
Distribution of GAPF-positive regions and copy-number gains on chromosomes 8, 11, and 12 in breast cancers. Genome graphs of GAPF-positive regions (P < 0.001, log2 signal ratio > 1.5; triangles) and copy-number gains (average log2 signal ratio > 0.3; boxes) in primary invasive ductal carcinomas (A) and breast cancer cell lines (B). Locations of GAPF-positive regions were determined from tiling array analysis comparing breast cancer samples with pooled PBLs. Copy-number gains were detected by SNP arrays coupled with wavelet-based statistical analyses. Clusters of at least three GAPF-positive regions that had a <5% probability of randomly occurring within a 5-Mb window are marked by asterisks (*). Note the colocation of clusters and copy-number gains, especially in the primary tumors.


